

Weekend Review
Overview
For the last few weeks I've stated the intermediate uptrend remains intact, recent weakness appears relatively modest and contained, and negative sentiment is elevated. This week the US indices rallied strongly and resumed their intermediate trend higher. Remarkably, sentiment reportedly became even more negative.
The AAII bullish percentage number got a lot of airtime, as it fell to 17.8%, a level hit only 4 times in the last 25 years, while the number of neutrals clocked in at 52.9%, the highest level in 26 years.
Per Charles Rotblut it's extremely rare to see optimism below 20% and neutral above 50%, in fact it's only happened on five previous occasions, four times in 1988, and once in 1989, all of which resulted in strong forward returns over the next 6 and 12 months.
To be fair, as some perma bears went to great pains to point out, that doesn't necessarily mean people are bearish or positioned for weakness, as the bearish percentage fell significantly too, but with the latest fund flow data again showing further outflows from equities, as has been the case for many weeks now, they're clearly not bullish or positioned for further upside either, leaving the potential for a major rotation back into equities should a sustained rally to new highs force their hand.
Markets
The Dow, S&P, and Nasdaq all closed at the high of the day.
Here's the S&P 500 on a 5-day range view:-
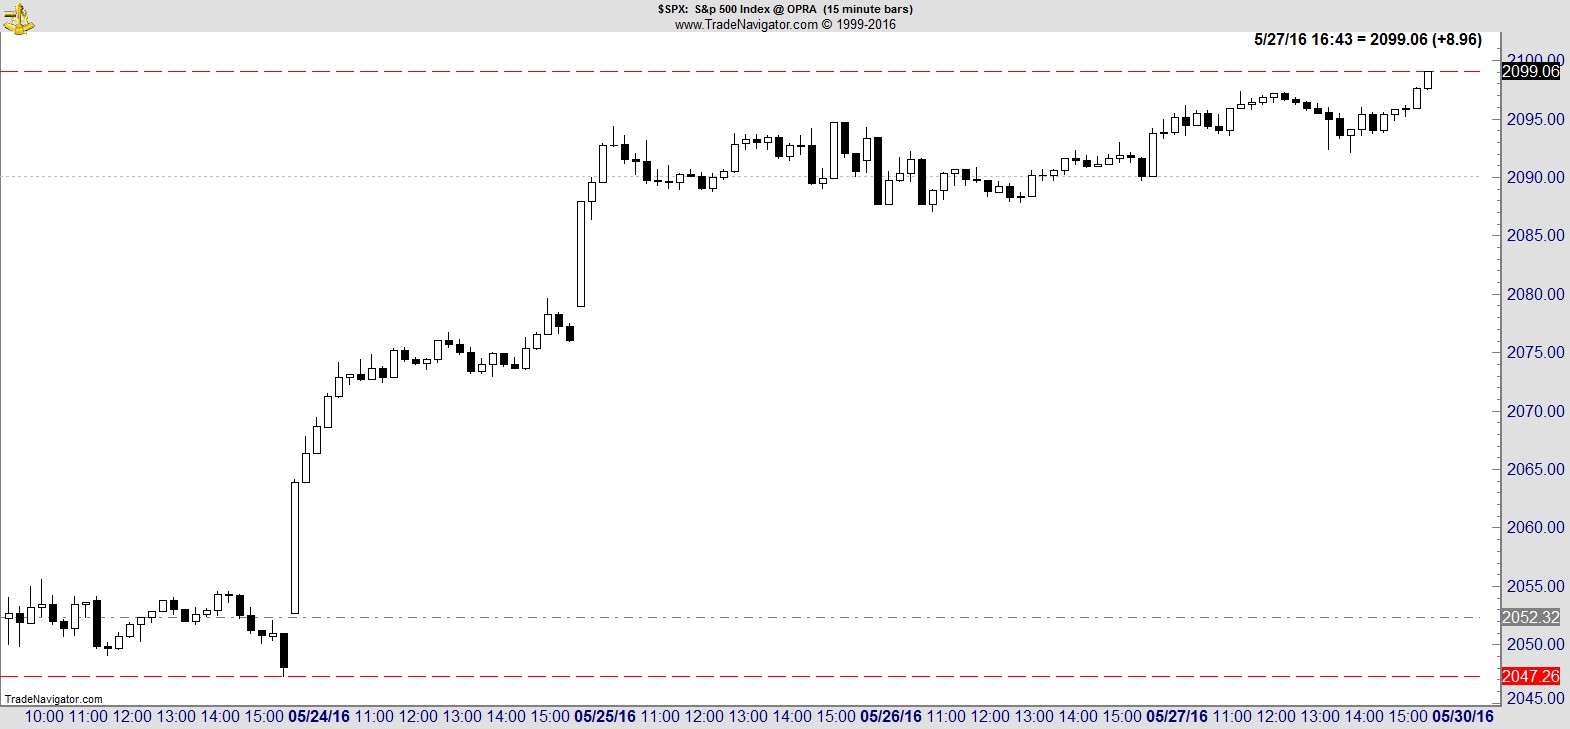
After a brief late-day pullback on Monday, it flew out of the gate on Tuesday morning and never looked back. For the rest of the week the bears weren't able to get anything going to the downside and the trend continued higher late into Friday going out at the high tick of the day and week.
Here's the context for that move on the $SPX daily chart:-
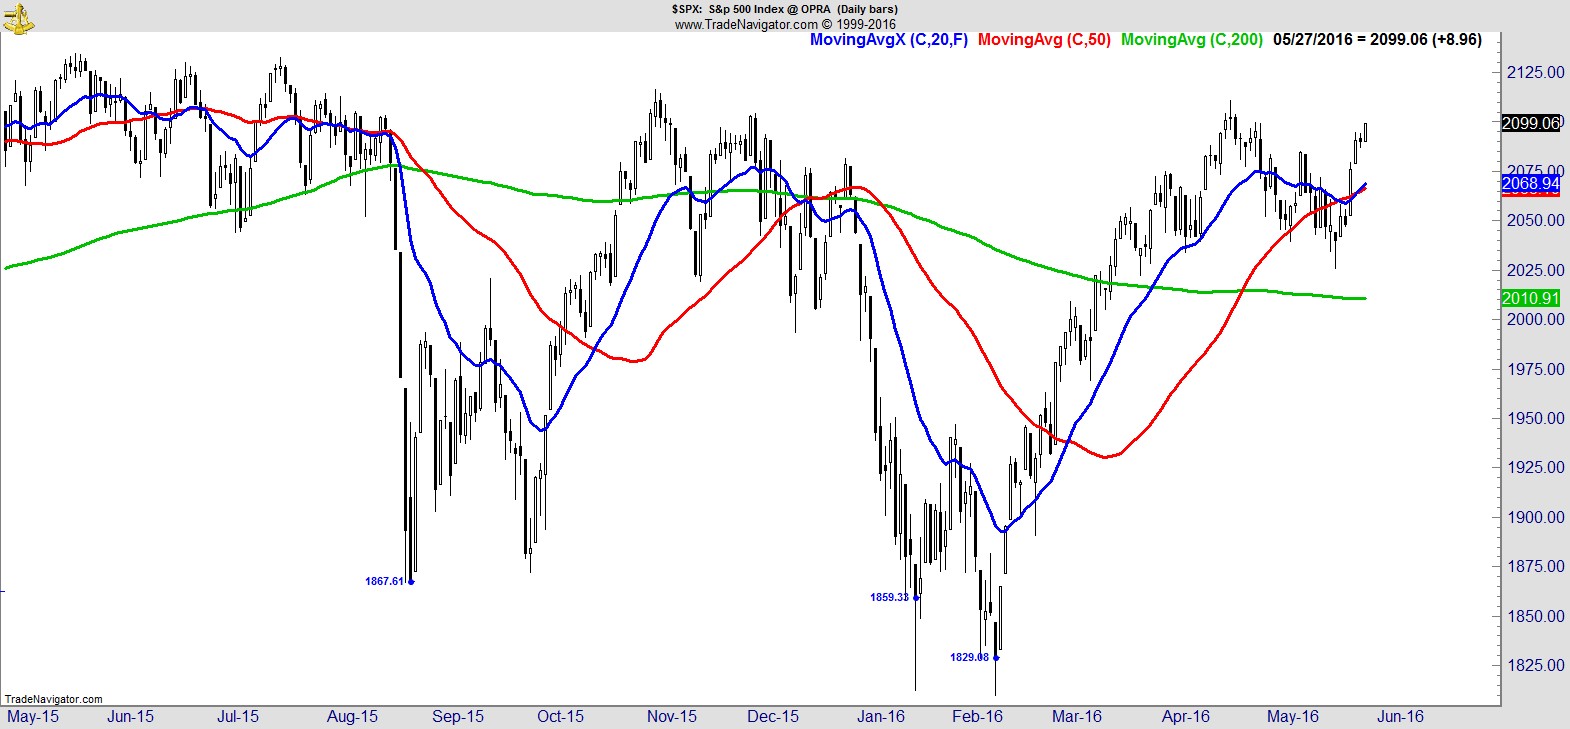
It's back above its 20 and 50-day MAs, and less than 2% from its all time high.
On the weekly chart you can see that's the highest weekly close since November 6th:-
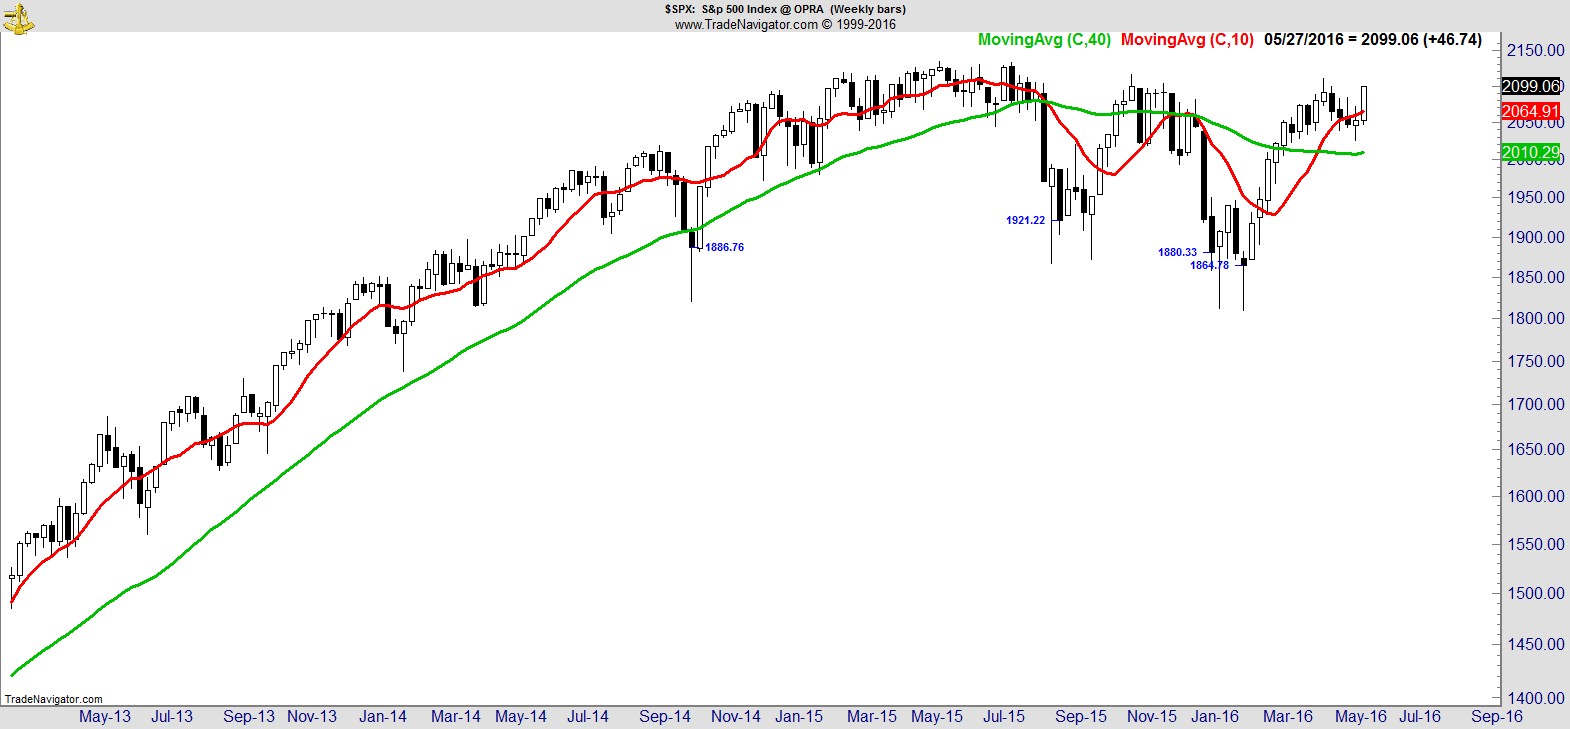
.
Here's the NASDAQ which has made back in two weeks pretty much everything it lost in the previous four:-
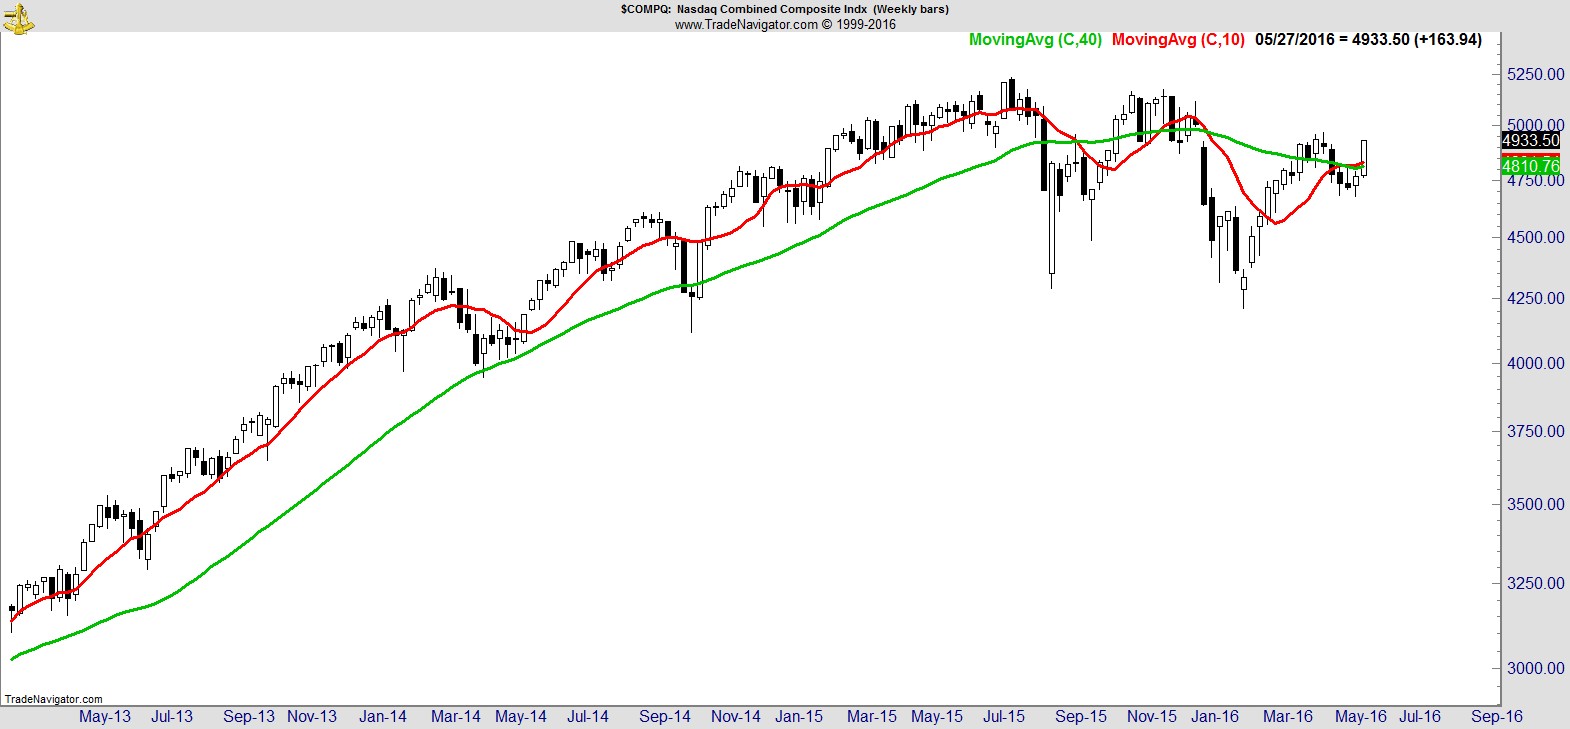
.
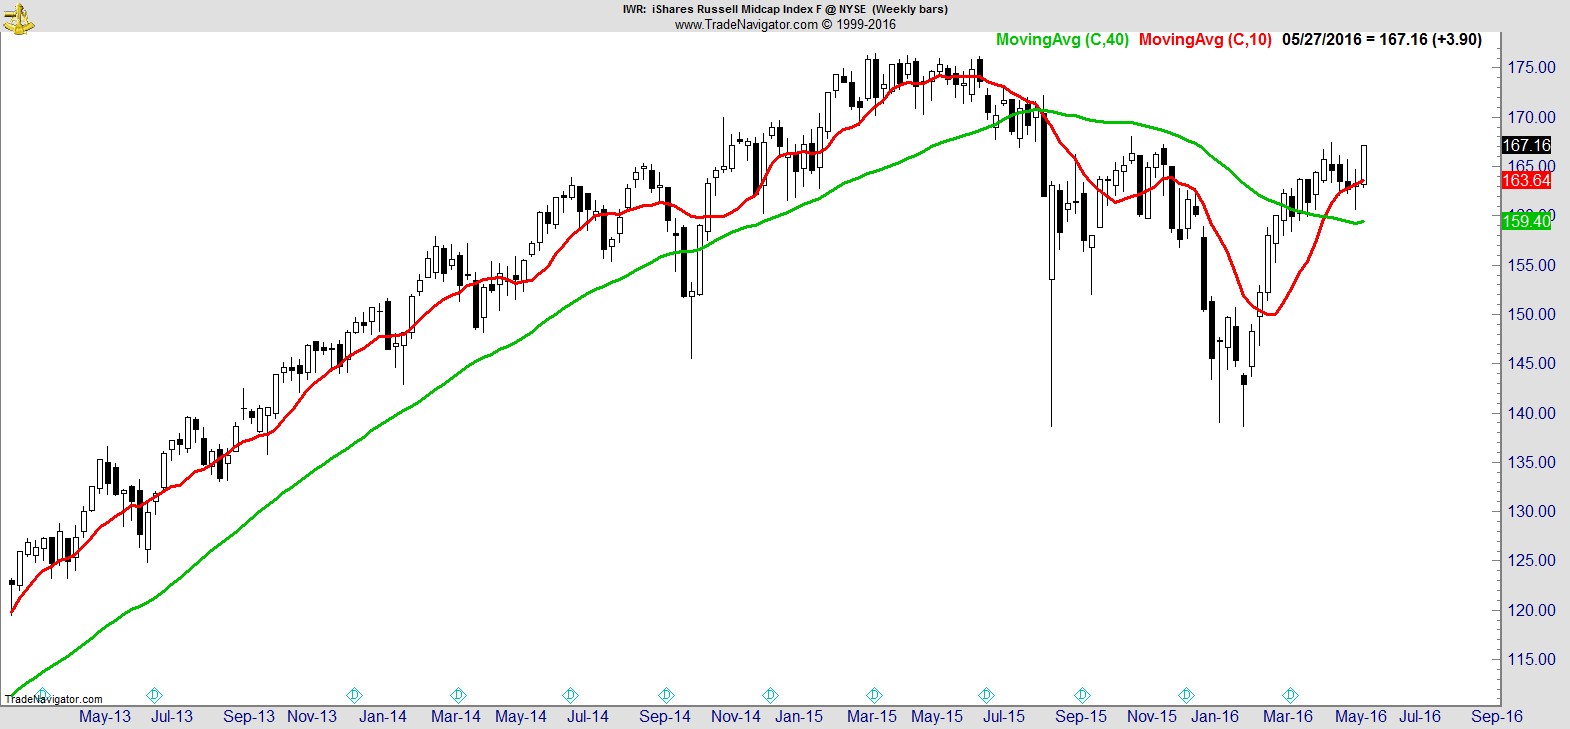
Here's the Midcap ($IWR) with the highest weekly close since 8/14/15.
.
Finally here's the Russell with the highest weekly close since 12/25, and it continues to make good progress relative to the $SPX:-
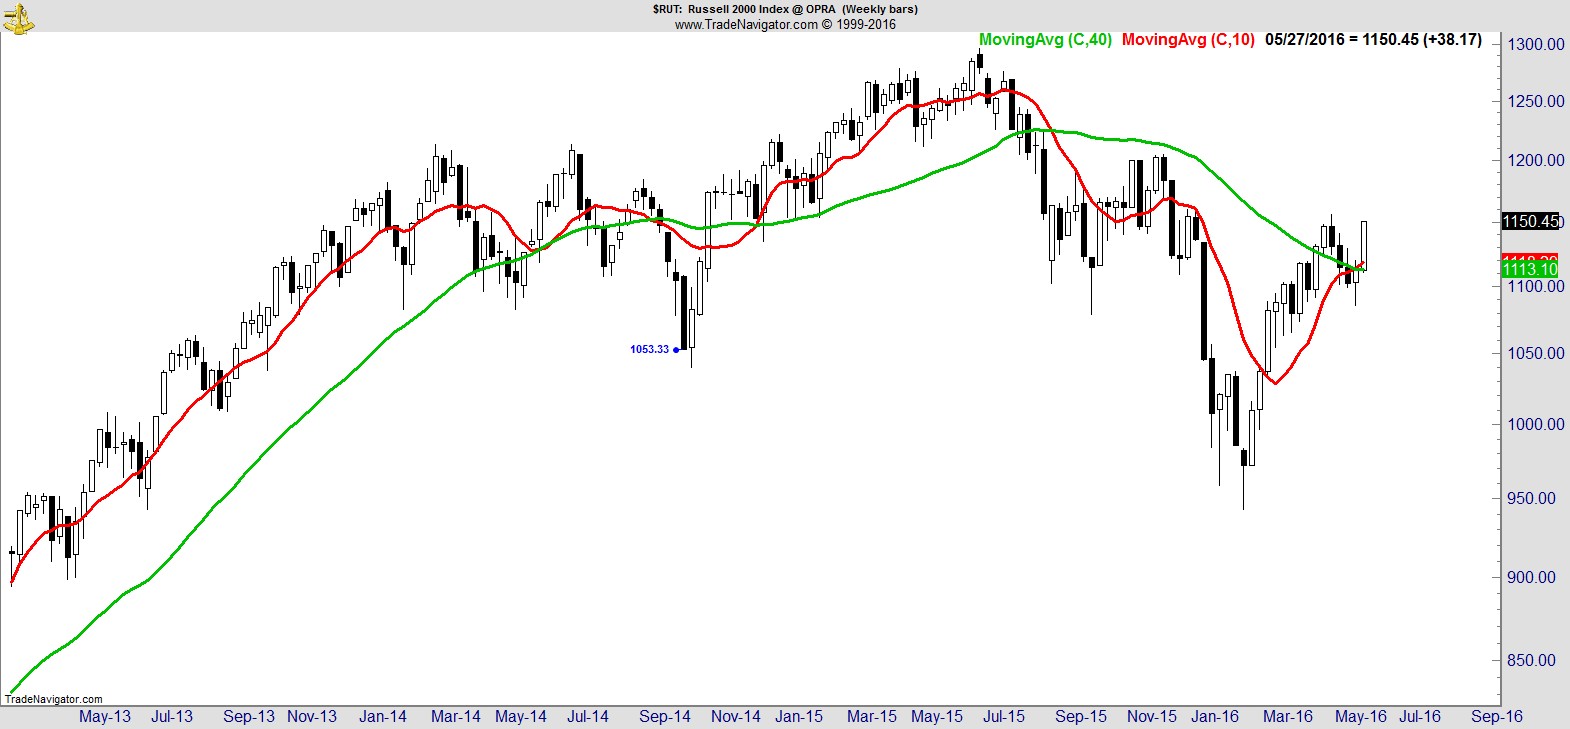
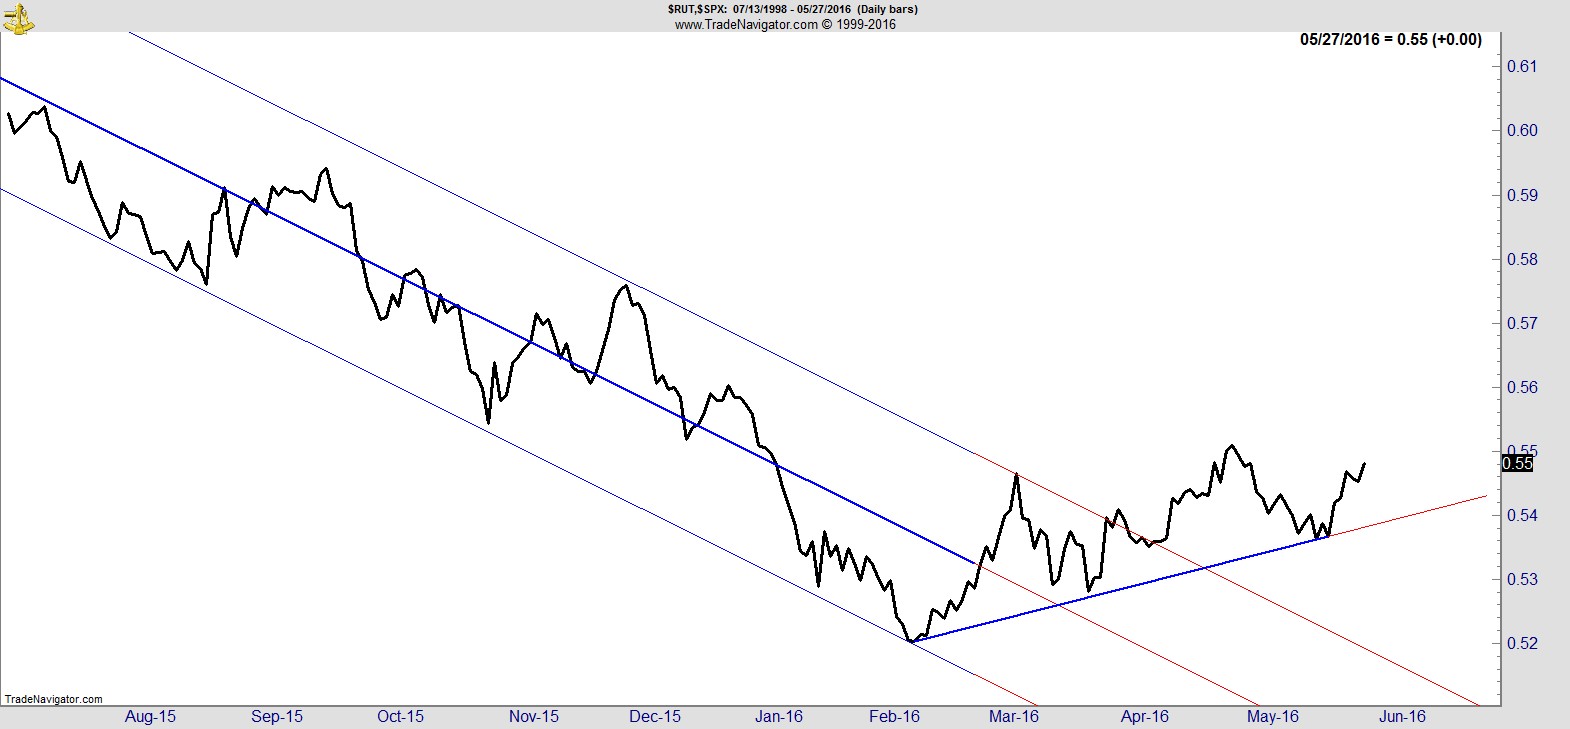
.
In addition to decent gains in all the major indices, breadth continues to improve. Here's the cumulative advance/decline for the NYSE at all time highs, and for the S&P, a fraction below its highs.
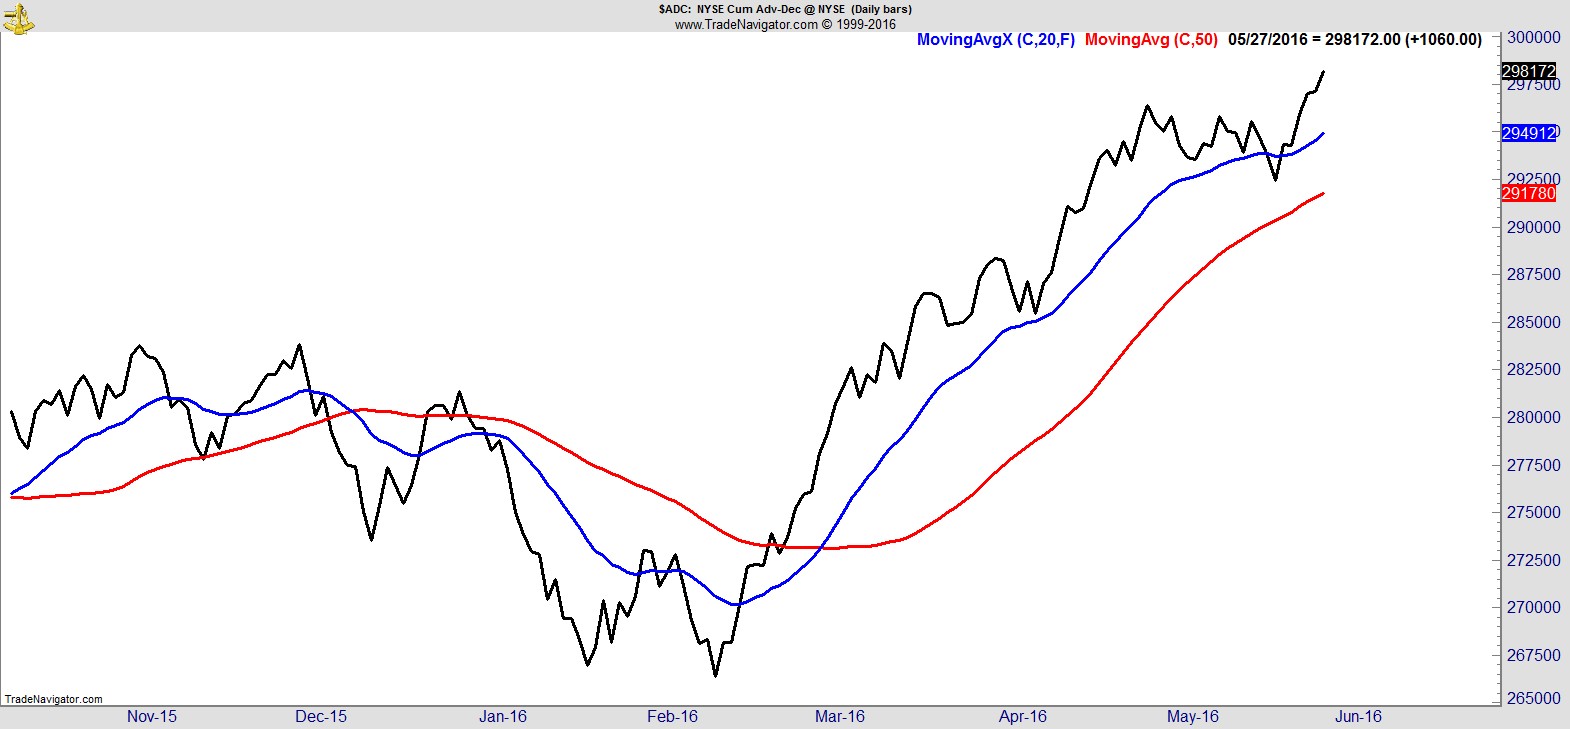
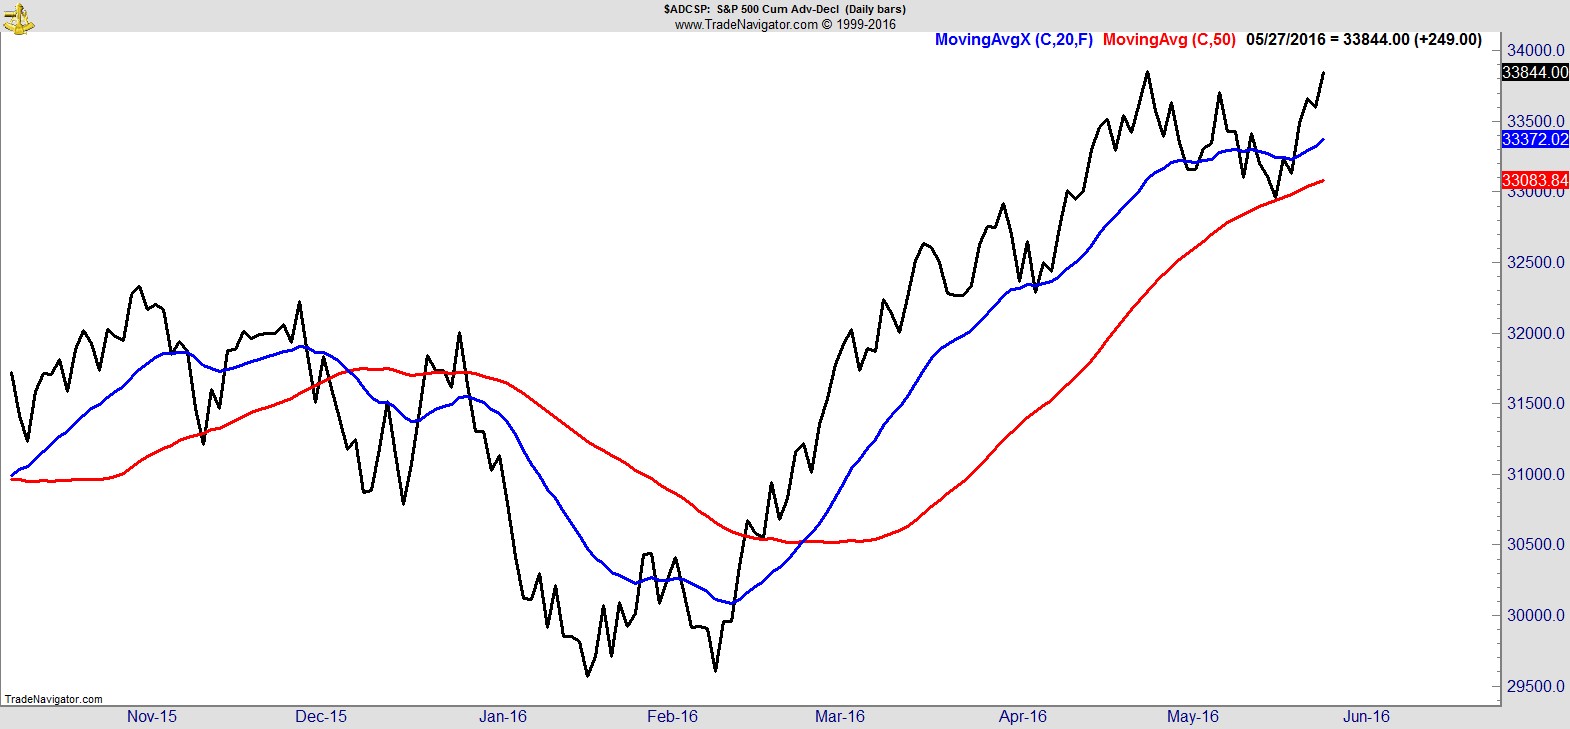
.
The Common-stock-only A/D isn't at all time highs yet, but it also continues to improve.
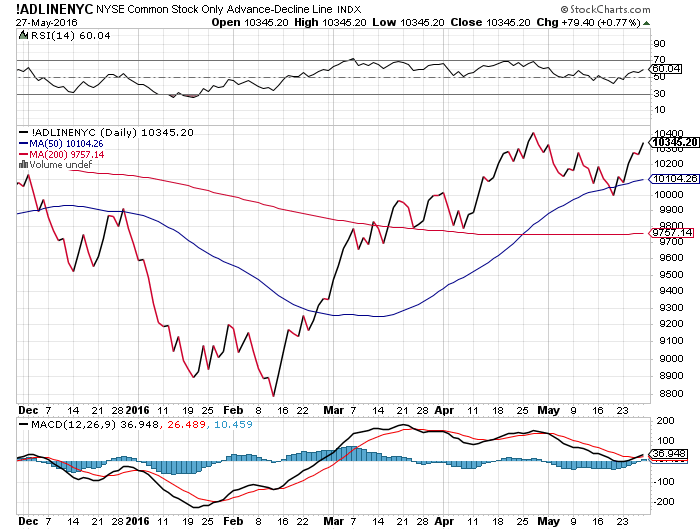
.
Sector Analysis
Something I've mentioned in previous weeks is the perception that the fewer number of stocks making all time highs is somehow representative of breadth being poor. This simply isn't true. At it's most basic level breadth is measuring the number of advancing issues relative to the number of declining issues. They just have to be advancing. They don't have to be making all time highs.
Recall, that a few months ago, many utilities and consumer staples were making all time highs week after week, and this was seen as being a negative because they're traditionally safe havens and defensive sectors, while many other sectors were coming under continued pressure. Plenty of defensive 52-week highs and all time highs, but poor breadth for the market overall.
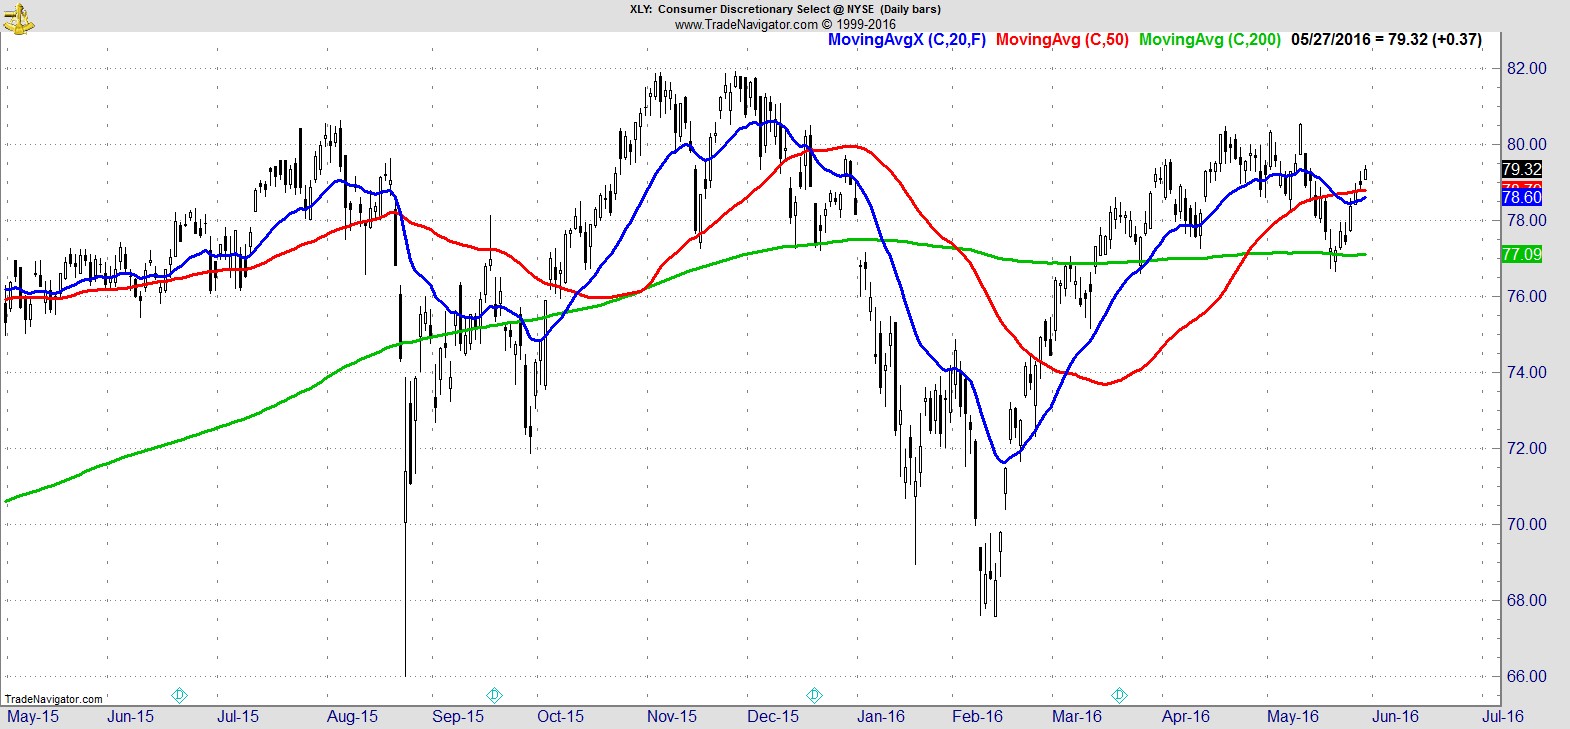
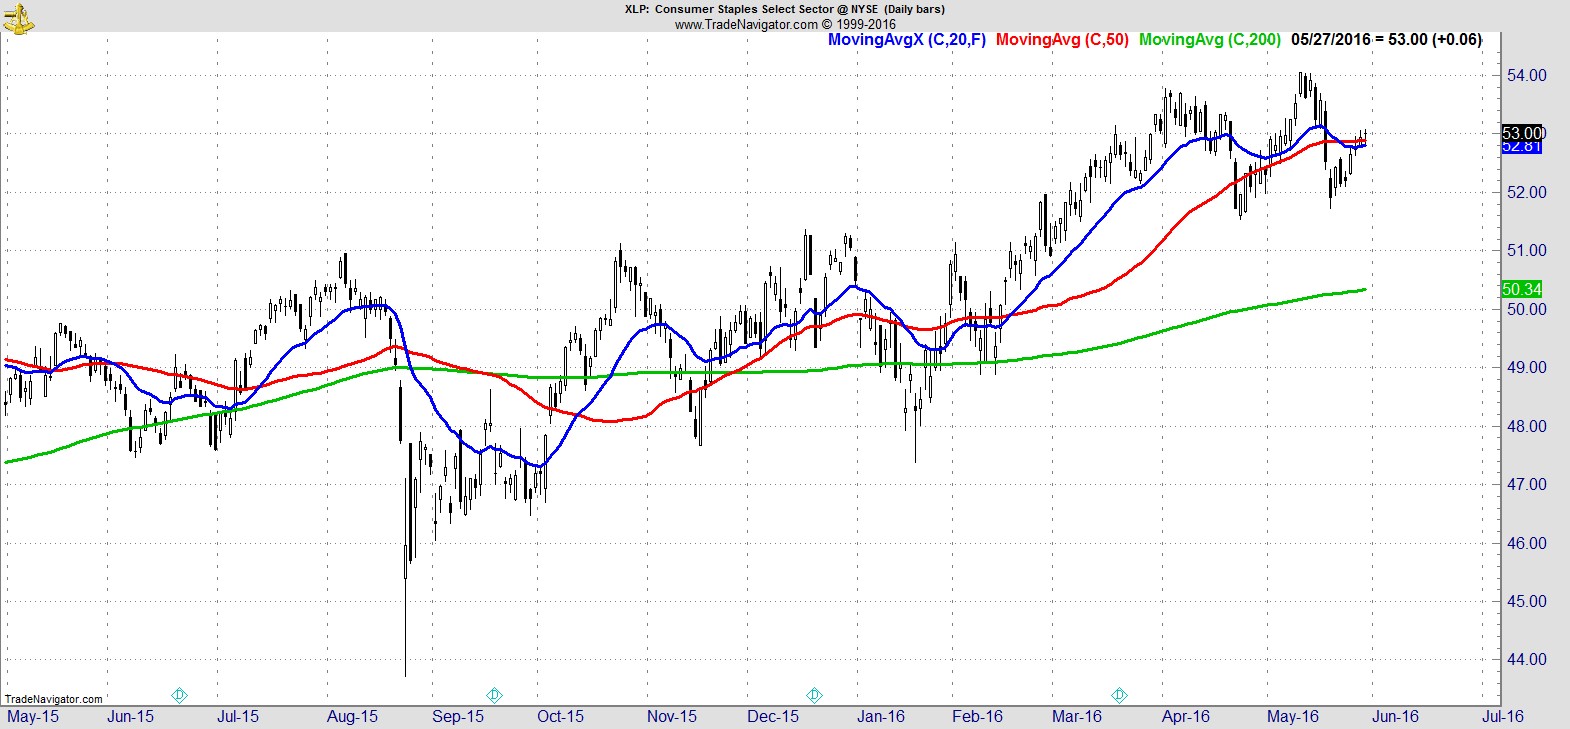
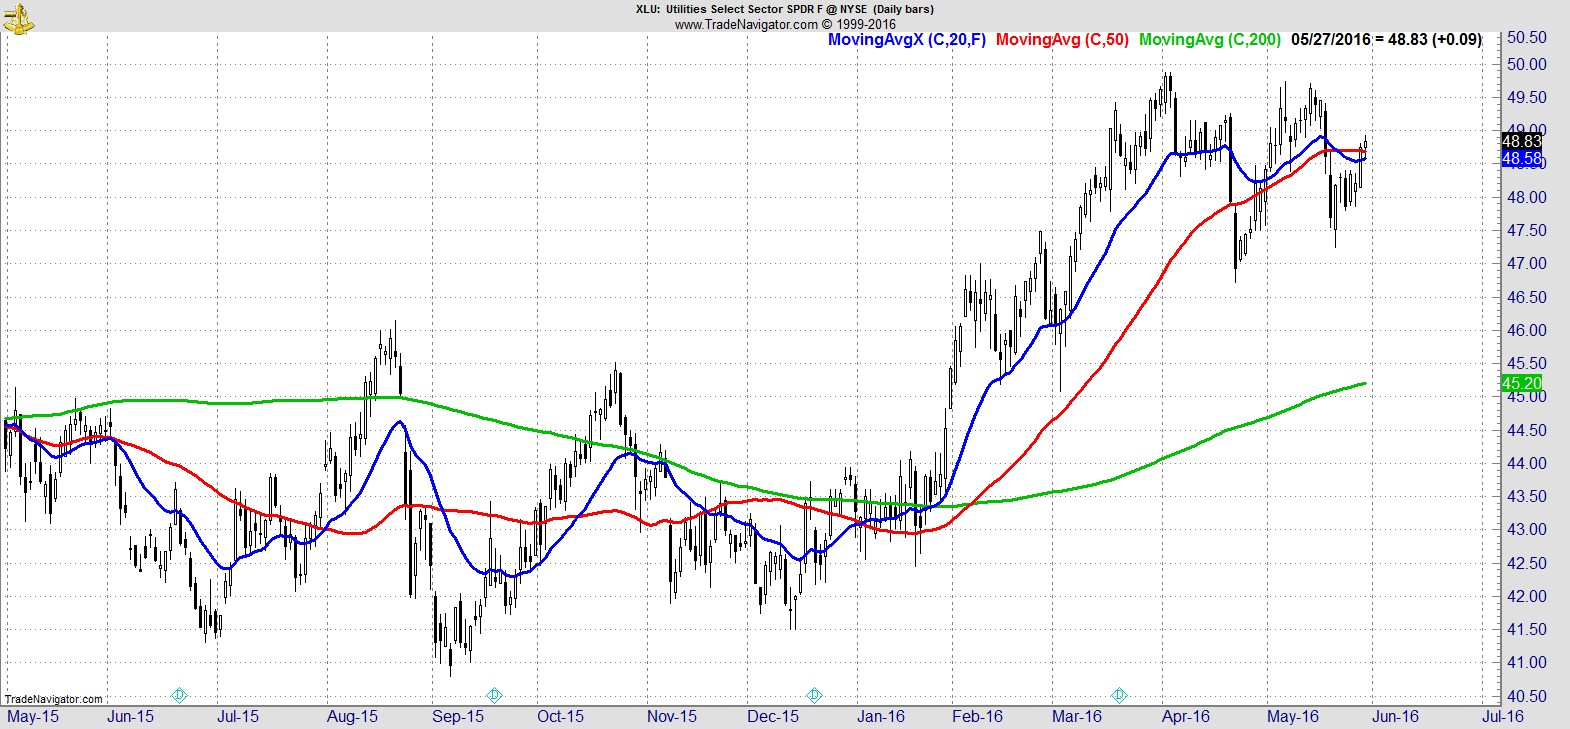
Now, utilities and consumer staples have pulled back, while all the other sectors have recovered. Instead of just two strong sectors, we now have strength across all sectors, as evidenced by the breadth measures I showed earlier at all time highs and what you'll see shortly with the nine Sector SPDRs. No sectors at all time highs, but all in intermediate uptrends, with positive breadth.
Which is better? You can't have it both ways and say it's a negative that only two sectors are responsible for all the new highs, but then when other sectors improve breadth is poor because now there are fewer new highs!
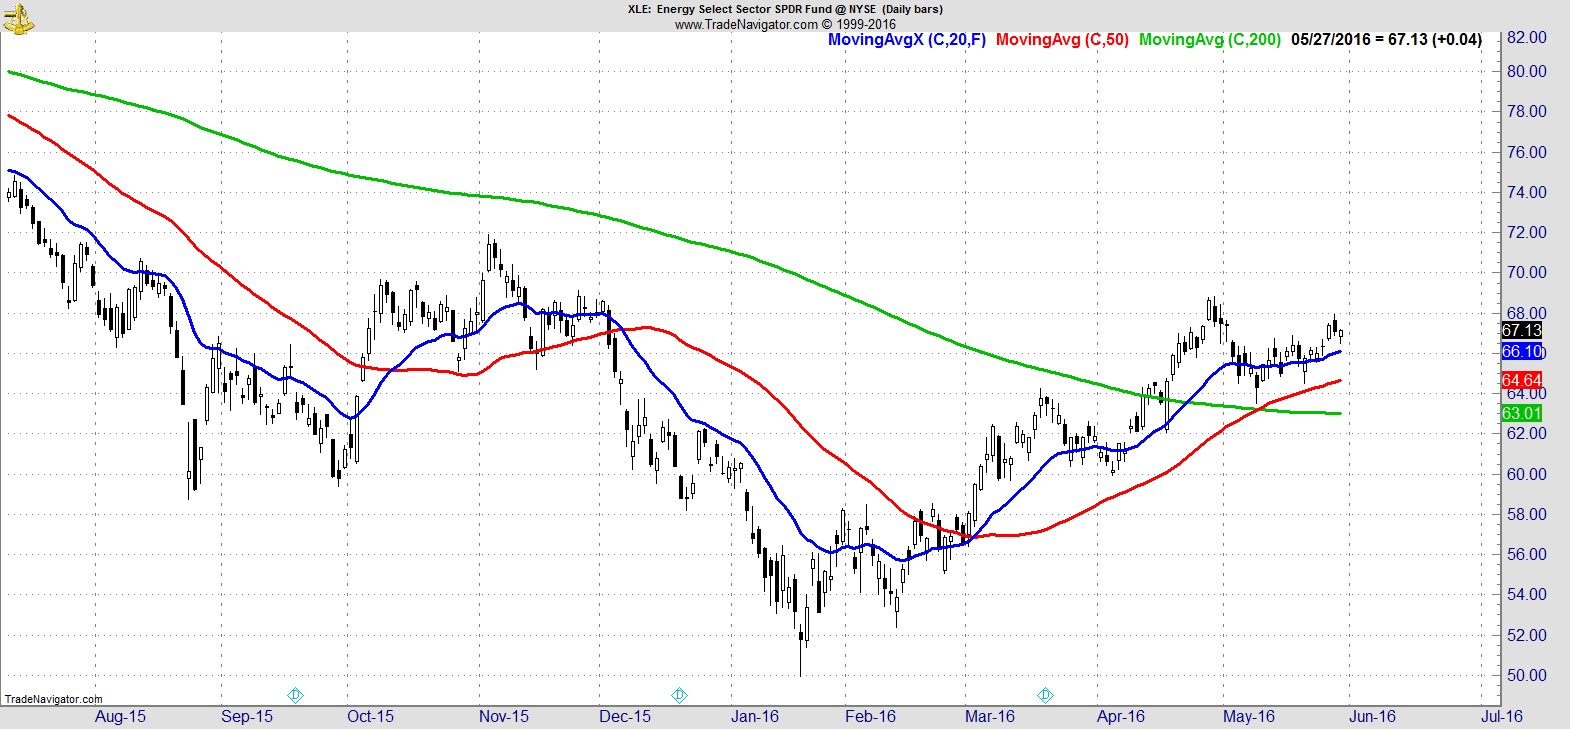
Sectors like energy and materials had been in downtrends for months. They've both now been recovering consistently for weeks, but you don't need to wait for all time highs for something to be in an uptrend.
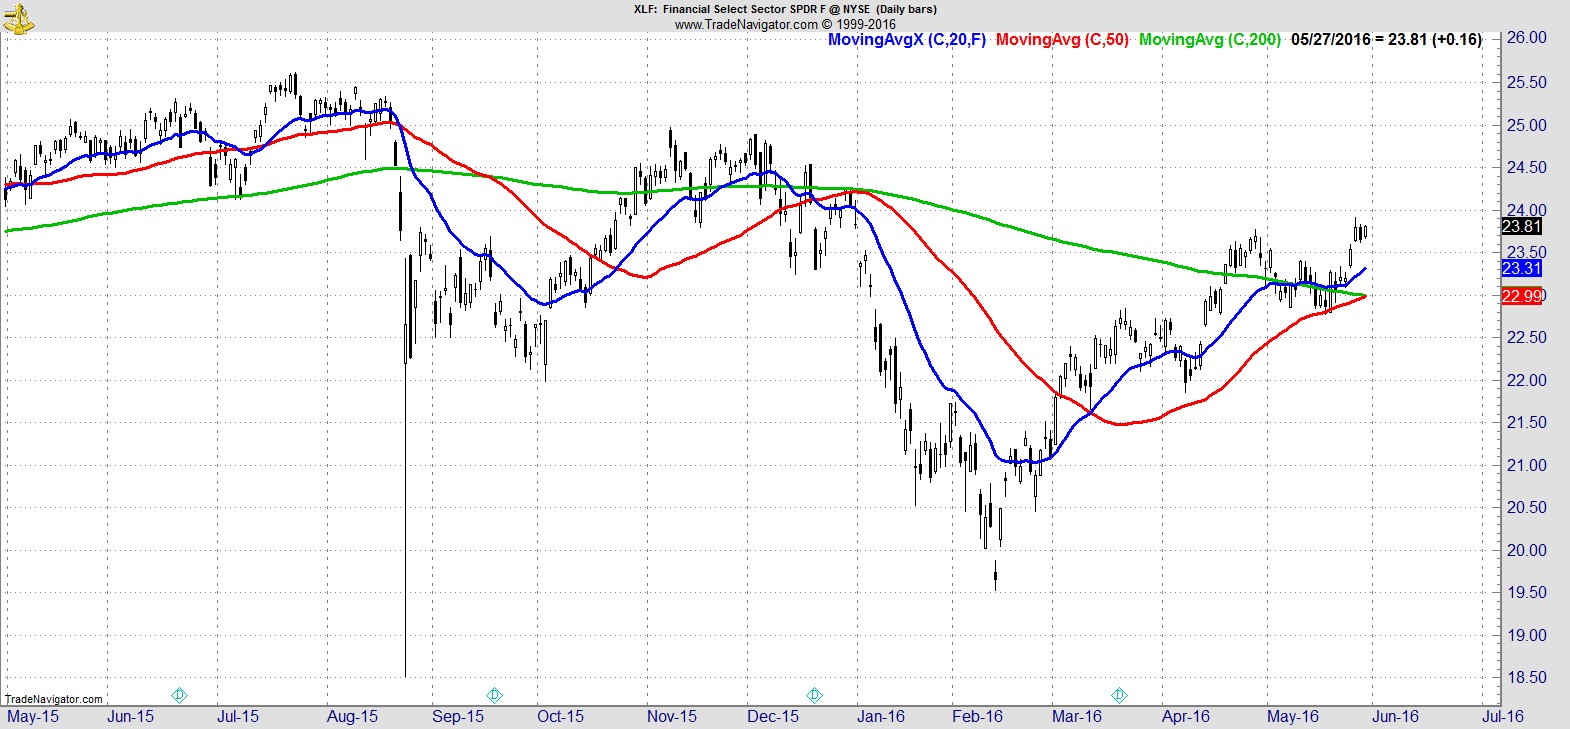
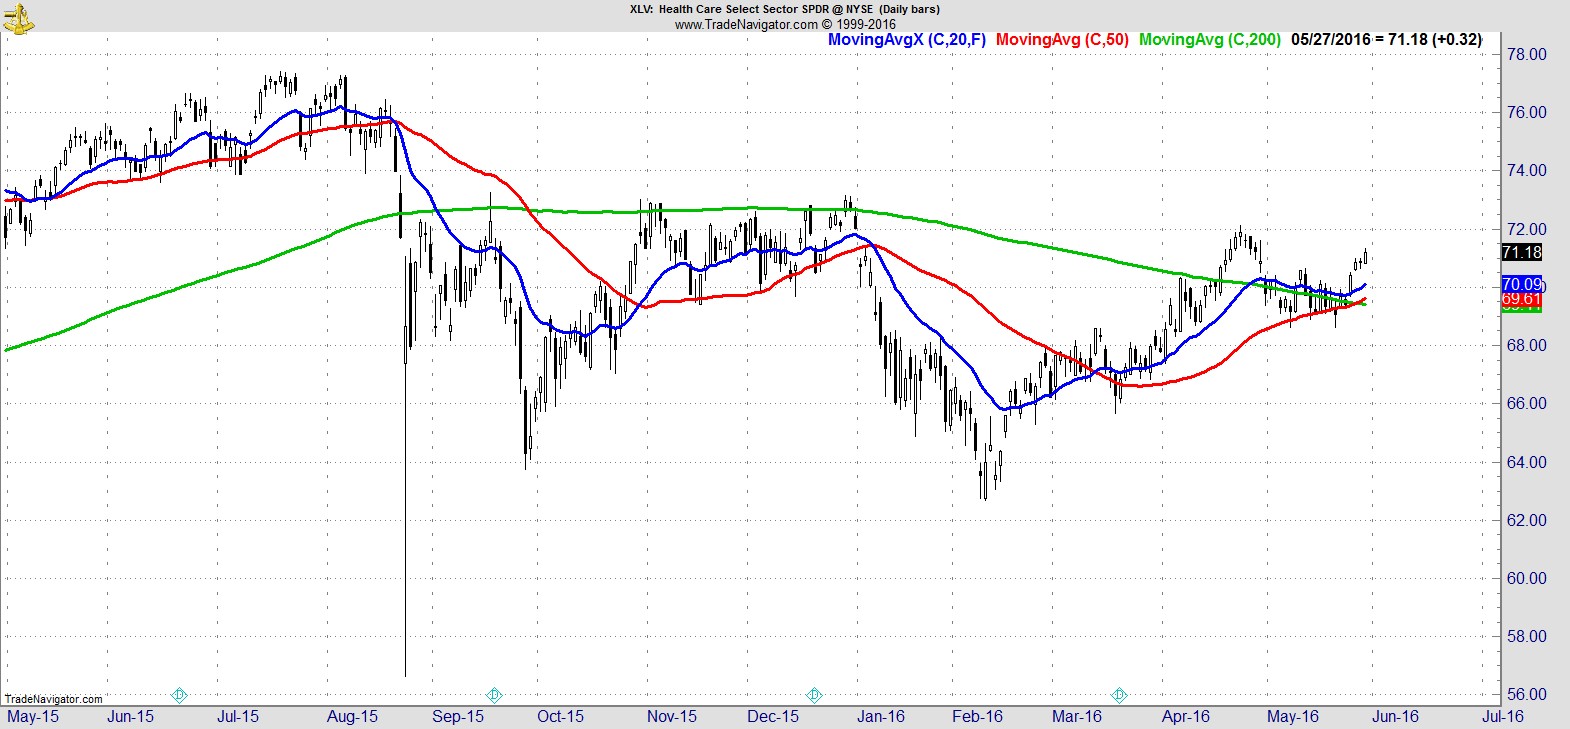
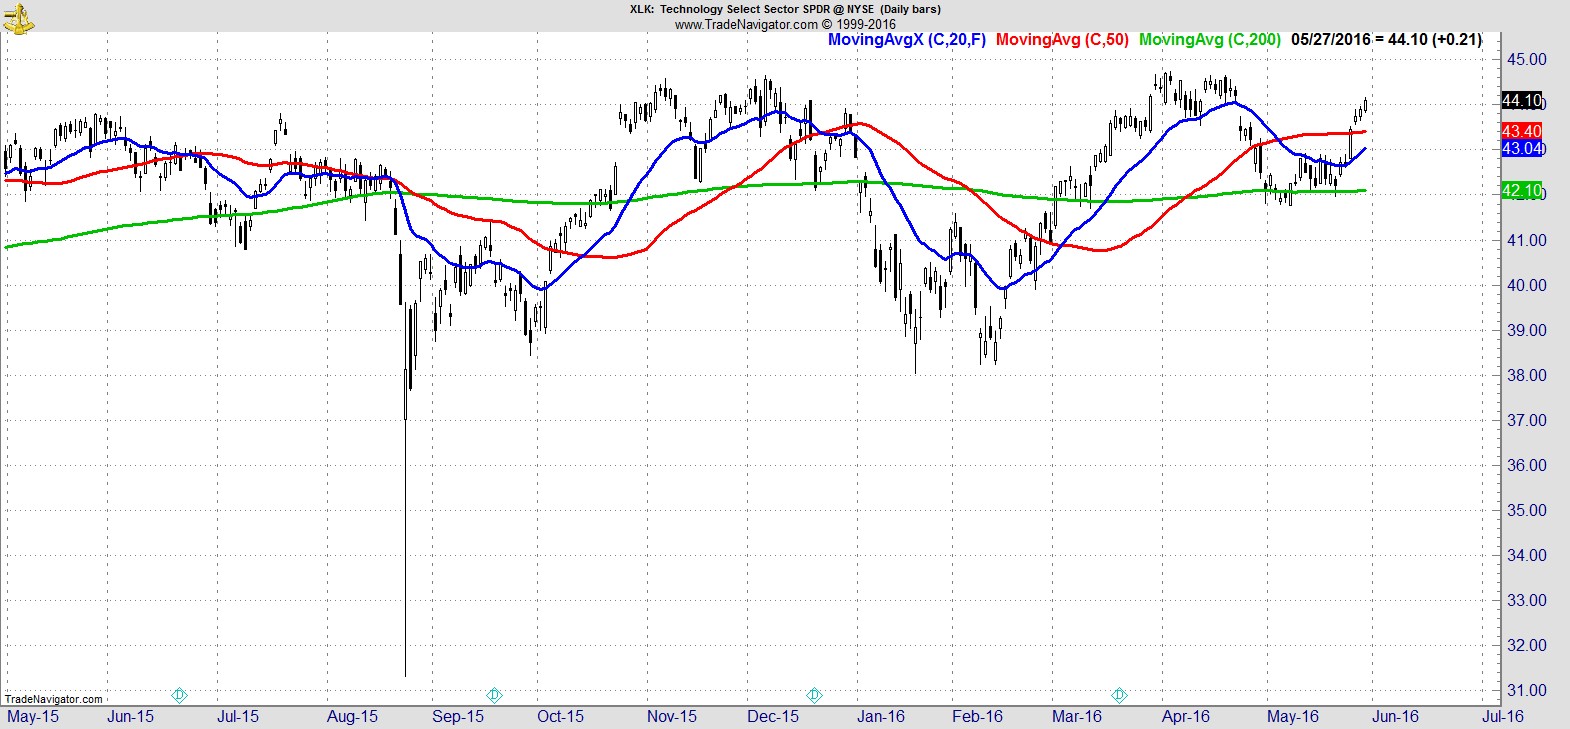
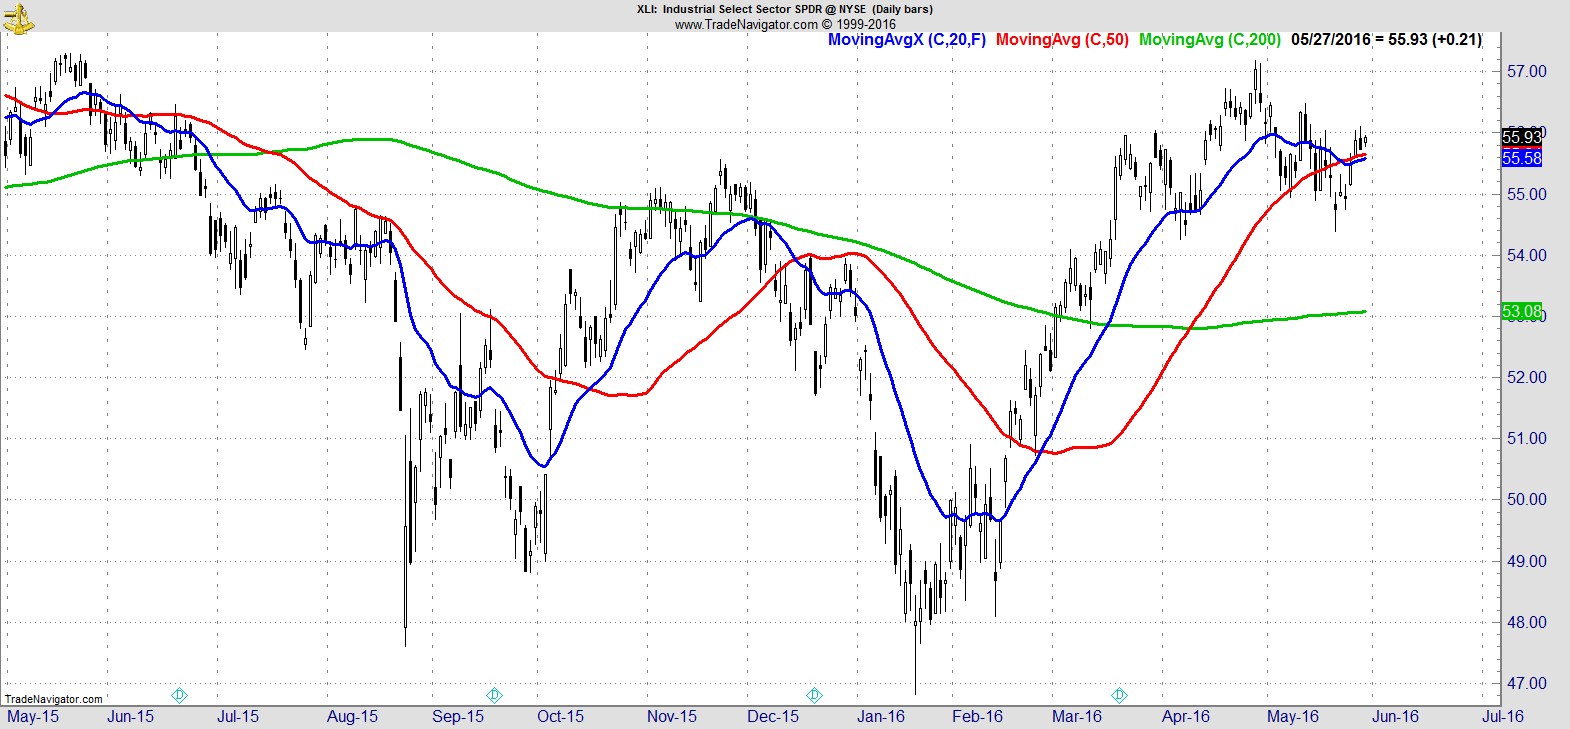
A look at the nine S&P Sector SPDRs demonstrates this point perfectly.
In fact, this has been the hardest week to rank them I can recall, because there is very little to distinguish one from the other. In no particular order:-
Financials ($XLF)
.
Materials ($XLB)
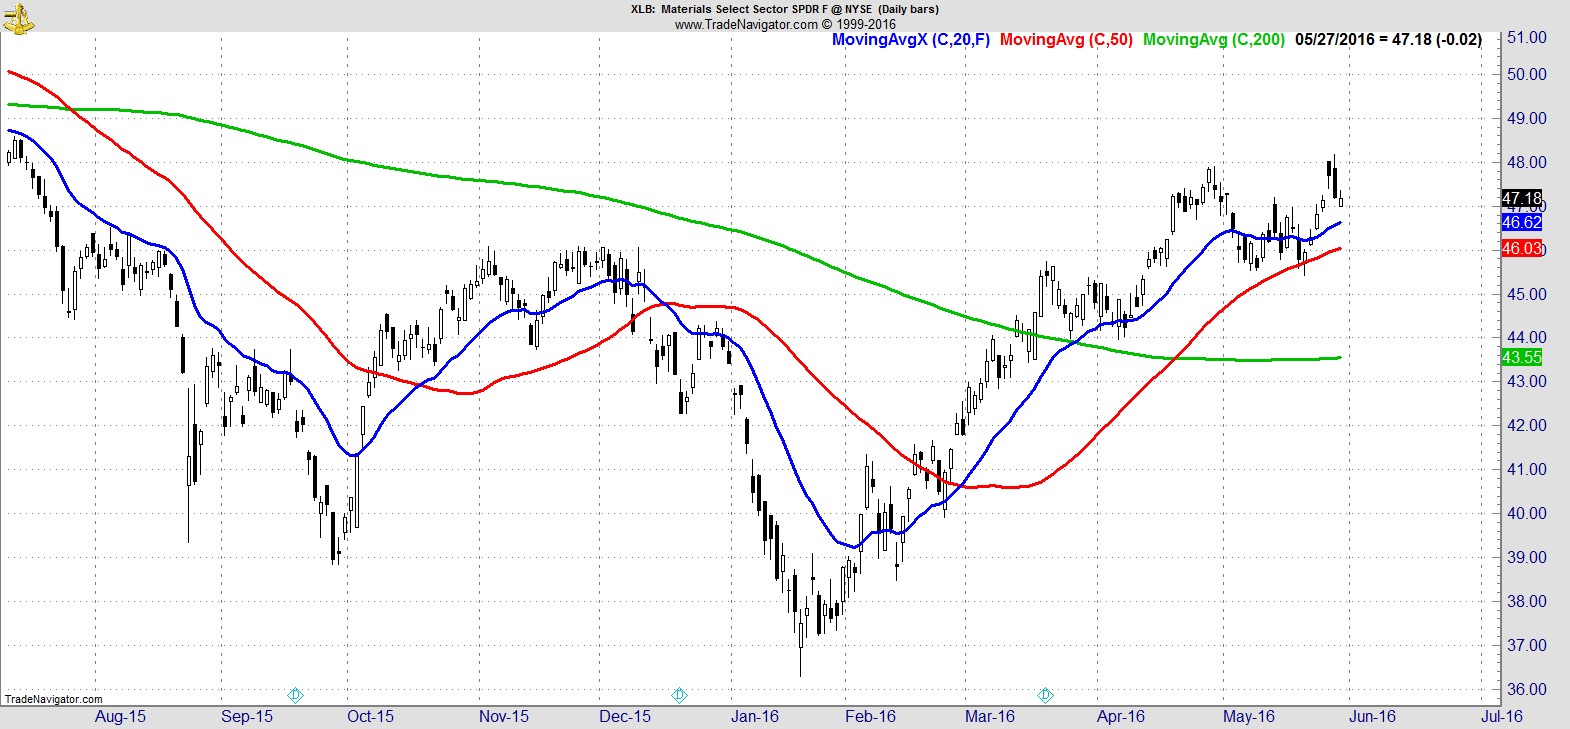
.
Energy ($XLE)
.
Healthcare ($XLV)
.
Technology ($XLK)
.
Industrials ($XLI)
.
Consumer Discretionary ($XLY)
.
Consumer Staples ($XLP)
.
Utilities ($XLU)
.
I will simply highlight that all nine are above their 20, 50, and 200-day MAs, and combined with price, trend, improving breadth, and continued negative sentiment, the most likely path for the overall market is for the current uptrend to continue.
SUBSCRIBE FOR NEW PORTFOLIO SIGNALS, ADDITIONAL TRADE IDEAS, AND A COMPLETE WATCHLIST.
.
Recent free content from Jon Boorman
-
 Weekend Review and Watchlist
— 9/30/17
Weekend Review and Watchlist
— 9/30/17
-
Weekend Review and Watchlist
— 9/22/17
-
Weekend Review and Watchlist
— 9/17/17
-
Weekend Review and Watchlist
— 9/10/17
-
Weekend Review and Watchlist
— 9/02/17