

AIG Long Set-up
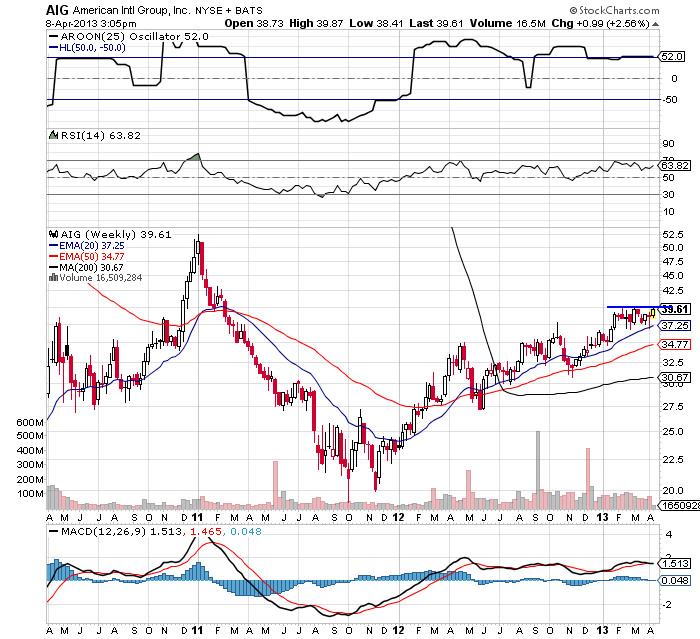
AIG has b3ecome a hedge fund favorite in 2013 as they bet on the insurers recovery. The weekly chart shows recent resistance at $40 in the bullish up-trend, with the MACD above its zero line and the RSI pointing higher. A breakout above could send prices higher to the $50 Resistance from December 2011 highs.
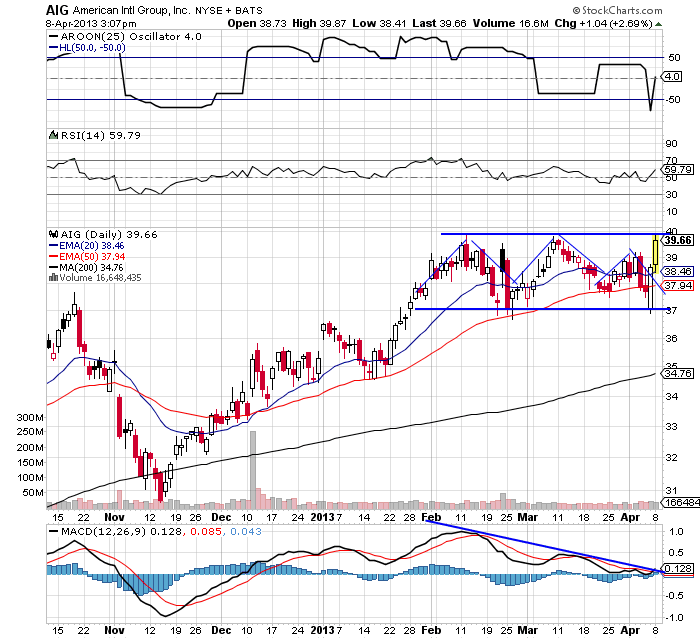
Daily chart shows a failed H$S pattern with neckline support at $37. Bearish MACD divergence is still there, but is attempting a bullish cross. A confirmed breakout above $40 would trigger a long position.
Recent free content from Zack Armstrong
-
 Final Trade
— 5/06/13
Final Trade
— 5/06/13
-
Play The Channel Breakout In These Two Set-Ups
— 4/25/13
-
Popular (BPOP) Long Set-Up
— 4/25/13
-
Jamba Juice Trade Set-up
— 4/10/13
-
Additional Trade Set-ups
— 4/09/13
No comments. Break the ice and be the first!
Error loading comments
Click here to retry
No comments found matching this filter
-
{[comment.author.username]} {[comment.author.username]} — Marketfy Staff — Maven — Member
Want to add a comment? Take me to the new comment box!

- 1 Campus Martius, Suite #200Detroit, MI 48226
- +1 877 440 9464