

I Like It Best When The Patterns Don’t Work
There is this misconception out there about technical analysis that there are these magical patterns that should always result in a specific move or direction. If and when they don’t, the misinformed chart watcher claims that technical analysis doesn’t work or that it no longer works or something along those ignorant lines. Do you actually think the market is going to make it that easy on us? Come on. Some cleverly named pattern in prices that everyone can easily recognize should always give the same result? Do you even hear how stupid that sounds?
Mr. Market has one job. And this is to make as many participants as possible look like complete fools at the worst possible time. This is what the market is here to do. It’s the way supply and demand works. We have many flaws as humans beings that we take those flaws into the marketplace which makes us do the worst possible things and the worst possible times. It is in our nature to be the most greedy when we really should be the most fearful, and then unfortunately we’re the most fearful at the exact moment that we should really be the most greedy. This is just the way it is. This phenomenon is seen constantly, particularly during extreme sentiment unwinds. Two of my favorite examples are US Treasury Bonds coming into the year and US Dollars this past May. As a market participant and student of the market, this is one of the more fascinating characteristics of the behavior of the global marketplace. Supply and Demand is an incredible thing.
Today I wanted to talk a little bit about why I think it’s important to recognize that “chart patterns” help give us certain signals and set up potentially favorable risk/reward opportunities. But in my opinion and experience, it’s when these tradition chart patterns don’t do what they tell you they are “supposed” to do. When prices continue to bump up against a specific resistance level and sell off from there every time, we know there are sellers there, for whatever the reason. Overhead supply exceeds any demand that might be at that specific price level. Ultimately, if/when the sellers are finished selling and supply dries up, price breaks out and goes on to new highs. We now know that demand exceeds supply at that particular price level. There are now more buyers than sellers there. When price ultimately returns back to that price, remember demand exceeds supply there, so prices bounce. Former resistance has now turned into support. This is what we call Polarity.
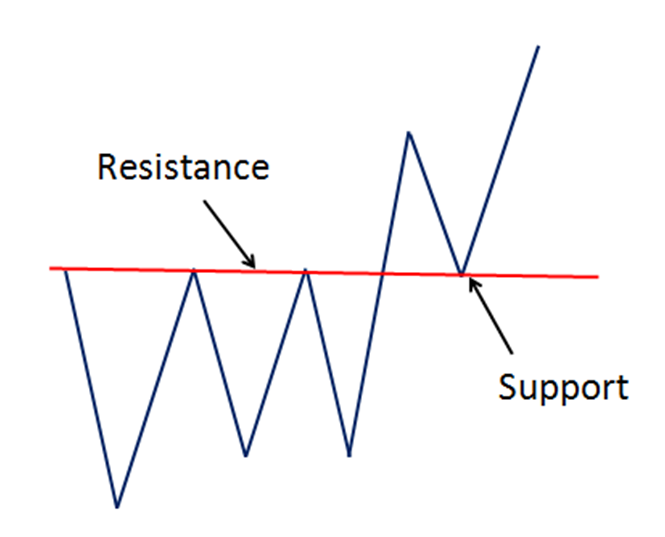
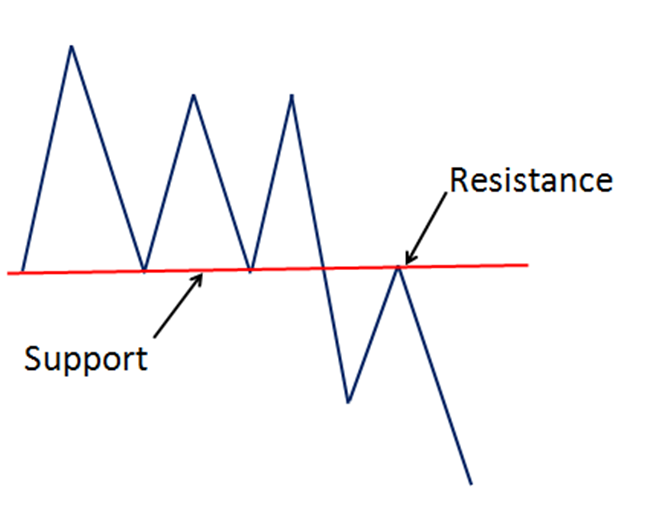
As you can see in this graphic, former resistance turned into support down the road. But the same can be seen on the flip side. When price continuously bounces off a specific level, we know that there is more demand than supply at that price, for whatever the reason. Eventually if/when prices break below those levels, we know that demand has dried up and now there is more supply than demand at that price. More sellers than buyers, if you well. So any time that prices rally back to that former support, we know that supply overrules demand. This former support now turns into resistance. Again, that polarity discussed above.
This is supply and demand 101. We’re “taught” to buy the break out or sell the break down. Most people would agree this that this is a standard technical analysis principle. But over the years, I’ve been able to recognize that the more favorable risk/reward opportunities actually come when these patterns don’t work out the way they tell us they’re supposed to. Some might call these “Failed Moves” or “Whipsaws”. It’s from these “failed patterns” that I believe come the best setups. The ignorant would use these scenarios as an excuse to criticize something they clearly know nothing about. Some of us like to use these to try and make money. Because remember, the only reason we are in the market in the first place is to make money. There is literally zero other reason to be here. This is something that is easily forgotten by some, and I’m not sure why.
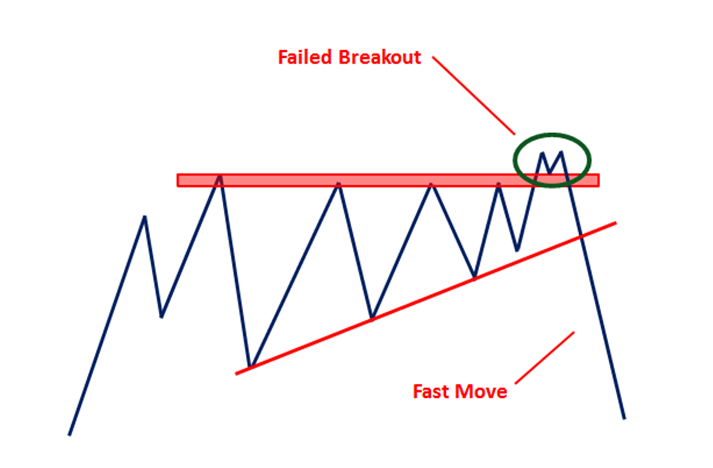
Here are two good examples of these failed moves. Rather than break out to new highs and hold above that former resistance, the breakout fails and a fast move in the opposite direction develops. This is where the old saying, “from failed moves come fast moves”, comes from. You see, what happens is that market participants trying to buy this particular security wait for the breakout in order to get long. Short sellers will also keep a buy stop above that level. So simultaneously, new longs are coming in to the market and former shorts are getting their buy stops triggered and buy automatically back their shorts.
This next part is what causes the ensuing violent sell-off. A day or two later or sometimes even that very same day, prices begin to roll over and fall back below that former resistance. This leaves the new longs holding the bag and get “stuck” up there above overhead supply while at the same time, short sellers that had previously been in the trade, are no longer short the stock. The only way for the new longs to solve this dilemma is to sell the stock they just bought. In addition the short sellers that have to get back in the trade then re-short the position. This causes massive selling when there were already natural sellers at this price. This then drives the momentum players to get involved who begin to short it as well, which then cause more longs up above previous supply to throw in the towel and sell, which causes more frustration to the stopped-out short sellers that haven’t re-shorted, and now they have to sell it too. This brings in more momentum players and the vicious downward cycle of selling creates a violent down move in price. Hence, “from failed move come fast moves”.
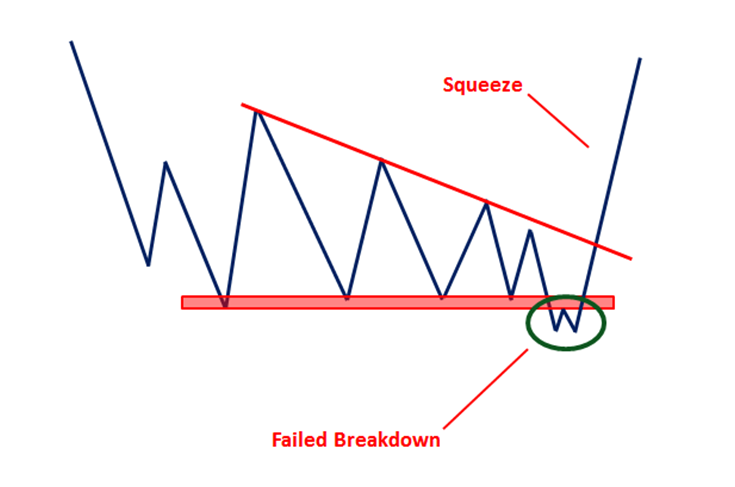
Same thing to the upside. When support is broken, short sellers get excited and start selling. Participants that had previously been long above support now get their stop losses triggered to the downside. But when prices start to creep back above former support, whether a few days later or even that day, the same problem mentioned above is created. Prices begin to rally and short-sellers are now stuck below that support level. Longs that had been long are now no longer in the trade. This causes shorts to get squeezed into covering and start buying back their trades in order to unwind the position. Longs watching the stock rip now have to frustratingly buy it back. This brings in the momentum players, in addition to the natural demand that had already been there, which causes even more shorts to have to cover, which causes more frustrated longs to buy it again. The same phenomenon detailed above can be recognized.
The execution from our standpoint is the best part. When we recognize that this scenario is potentially playing out, the risk vs reward becomes very much skewed in our favor. The entry point is the minute that price gets back below former overhead supply, in the case of a failed breakout. Our stop loss is just above that area. So if prices do break back above resistance then all bets are off and prices are likely going a lot higher. Therefore we would no longer want to be short. But if we’re right, the sell-off can be incredible. The risk is so well defined that for me personally, these are the perfect entry points.
Same thing on a failed breakdown. Once prices break and begin to creep back above former support, that’s the entry. The stop loss is placed back below former support. Again, if we’re right, the result can and should be a massive rally to the upside. The risk is very well defined giving us a risk vs reward opportunity that is very much skewed in our favor. This to us is the only thing we care about.
I’m going to try and make this part of an educational series of why I look for these types of patterns and what other characteristics help me identify them ahead of time. Momentum, smoothing mechanisms, sentiment and intermarket relationships also play a part in this price pattern recognition. We’ll let people continue to criticize technical analysis while we here will keep watching the behavior of the market and its participants in order to find the most favorable risk vs reward opportunities. This is the market. It is our time to be selfish. We’re only here to make money and there should be no other reason to participate. There is no right or wrong way to make money. Personally, I just prefer to find scenarios where we have the clear advantage. I believe the scenarios laid out above are good examples. And the best part is that this supply and demand behavior can be seen across asset classes: Stocks, Bonds, Commodities, Currencies, Interest Rates, ETFs, US Stock Market Indexes, etc. They are also seen across time frames; from 10-min charts to daily and even monthly charts.
Members of Eagle Bay Solutions receive weekly reports on various asset classes on multiple timeframes where we consistently point these out when these failed moves appear as well as anticipate even the possibility of one taking shape. If you are interested in learning more about our research reports, feel free to check outEagleBaySolutions.com or email info@eaglebaycapital.com to learn more.
Recent free content from J.C. Parets
-
 Here’s Way I think Rates Are Heading Lower
— 11/12/15
Here’s Way I think Rates Are Heading Lower
— 11/12/15
-
Support & Resistance 101: Apple Edition
— 11/10/15
-
 Video: Technical Analysis Webinar by JC Parets
— 10/01/15
Video: Technical Analysis Webinar by JC Parets
— 10/01/15
-
Find Your Edge: The Autumn 2015 AlphaShark Trading Symposium with a Presentation by J.C. Parets
— 9/25/15
-
Can Financials Correct 30% From Their Highs?
— 9/24/15
-
{[comment.author.username]} {[comment.author.username]} — Marketfy Staff — Maven — Member

- 1 Campus Martius, Suite #200Detroit, MI 48226
- +1 877 440 9464