

A Non-Random Walk Through Canadian Dollars
After the initial breakout earlier this year and successful retest of former resistance, I have consistently said that the USD/CAD chart is one of my favorites in the entire world. And you guys know how many I look at. More specifically I’ve liked this chart from a structural perspective because of the 4-5 years of basing. I don’t like it when people take victory laps after a good call because I constantly preach that it’s not about being right, but about making money and managing risk properly. So bragging about a great call contradicts that type of mentality. So I don’t like to do that myself. But today I am going to make an exception because for educational purposes I think that not pointing out how beautiful this base has been and the consequences of its breakout would be doing a disservice to all of us, particularly newer market participants. I have highlighted each point in the chart with a blue number.
When looking through charts, I like mine clean. I don’t like messy charts that are all over the place. I have to say, that this one really has behaved so well and remained so clean that it has almost been impossible for me not to love it. The first thing that stood out to me earlier this year (Point 1) was the initial breakout above several years of resistance. Here is the weekly chart showing this breakout above 106 to start the year that gave us an initial target just below 113 based on the 161.8% Fibonacci extension of the most recent decline, which took place from October 2011 to September 2012:
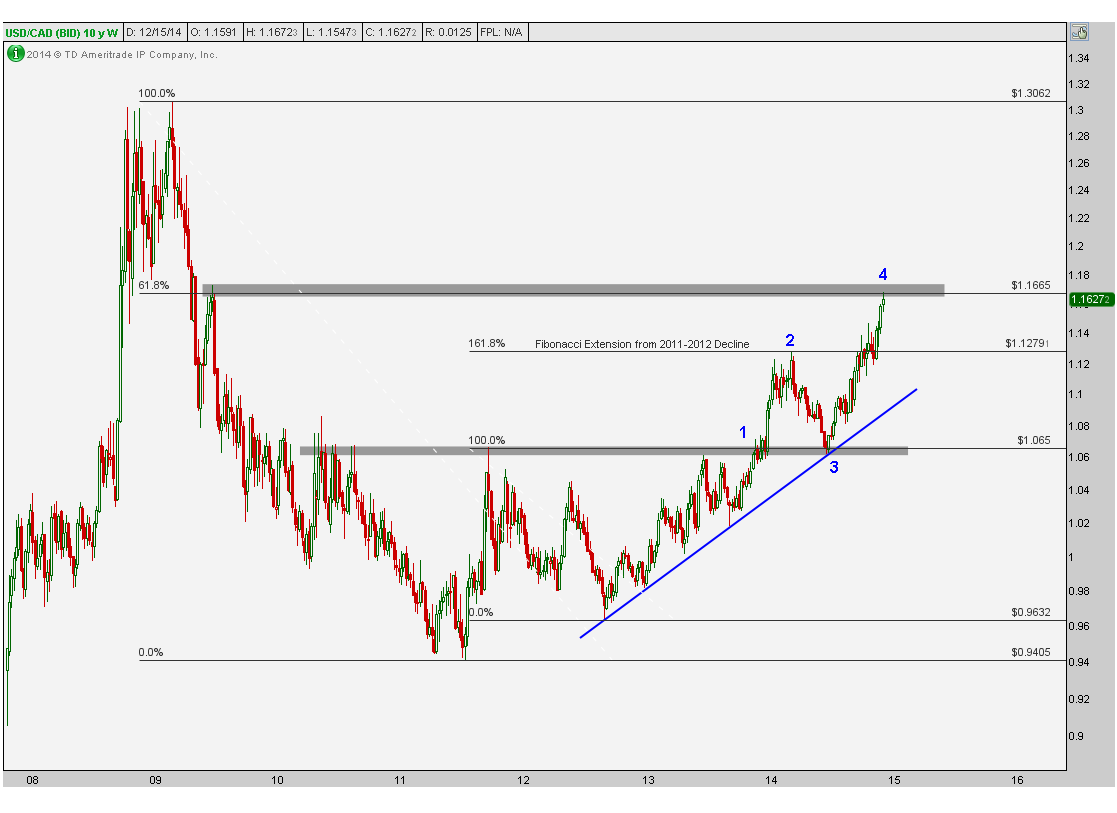
Once this initial target was achieved in March of this year (Point 2), prices pulled back and retested the initial breakout level. Notice how not only did former resistance turn into support (we call this “polarity”), but there was also an uptrend line from the 2012 lows at that exact same price (Point 3). After a successful retest, prices then rallied through former resistance in March and is currently hitting our target of 1.166 based on the 61.8% Fibonacci retracement of the entire 2009-2011 collapse from 1.30 to 0.94 (Point 4).
Here is a closer look at the most recent breakout and consolidation. In July prices got down to this 106 area that we can see on the weekly timeframe was former resistance since 2010 (Point 1). After rallying back to the March resistance this Fall (Point 2), prices began to consolidate and digest the gains while also acknowledging this overhead supply. That downtrend channel throughout November (Point 3) was the consolidation that it needed before heading up to the next target, which was the 161.8% Fibonacci extension of the 2014 correction and retest of that former resistance (Point 4). This also happened to be the 61.8% Fibonacci retracement of the entire 2009-2011 decline which we can see on the weekly timeframe:
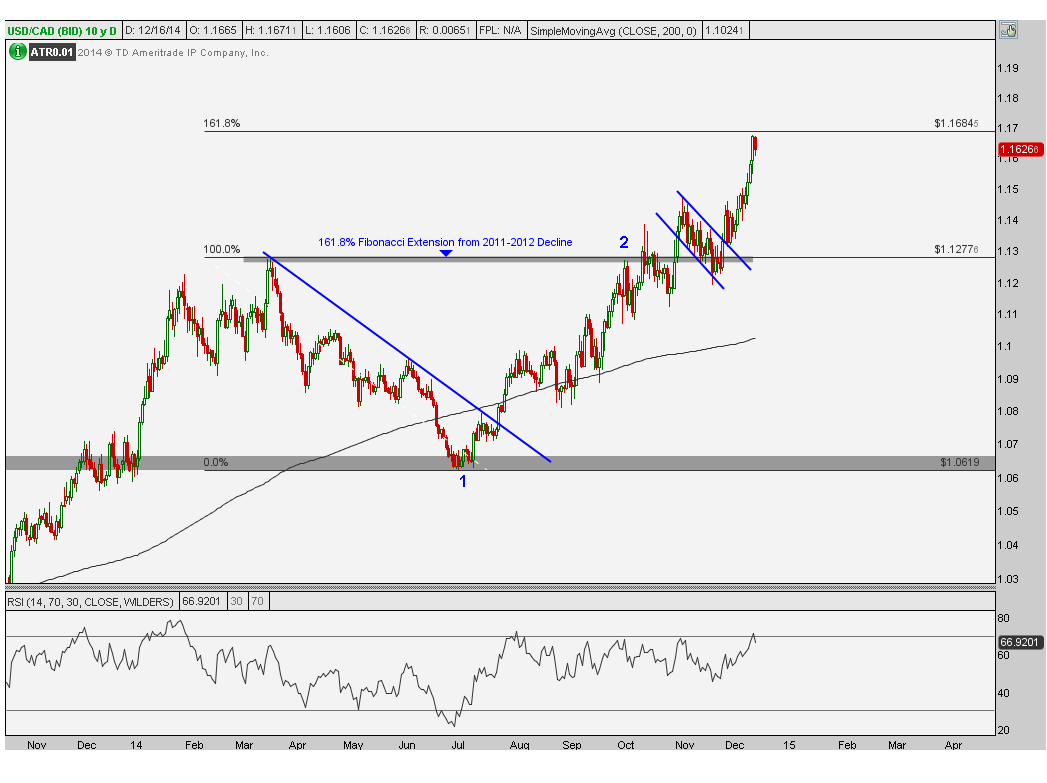
For me it’s best when there are multiple reasons for levels to be relevant, whether it represents former support/resistance or if it’s a Fibonacci extension/retracement level from a previous trend. I prefer both and I think this is a great example of these support/resistance clusters turning into powerful levels. At this point I think some acknowledgement of this level would be both normal and healthy. But if we can manage to breakout at some point above this 1.166 target of ours, there is little in the way of prices heading back towards the 2009 highs. It’s a bit premature to call for that now because we like to be disciplined and take profits when targets are achieved. But after some time passes, it might make a lot of sense to reevaluate and perhaps turn bullish once again. But we’ll worry about that down the road.
Members of Eagle Bay Solutions have received weekly updates on these charts and will continue to do so every week going forward as we gather additional data. Make sure you SIGN UP HERE to receive these weekly multi-timeframe reports. These reports 11 different currency crosses and 16 commodities, all on multiple timeframes, momentum pattern recognition and price projections.
Recent free content from J.C. Parets
-
 Canadian Dollars Are About To Explode Higher
— 10/07/15
Canadian Dollars Are About To Explode Higher
— 10/07/15
-
Gold Looks Ready For Its Next Leg Lower
— 9/30/15
-
Find Your Edge: The Autumn 2015 AlphaShark Trading Symposium with a Presentation by J.C. Parets
— 9/25/15
-
Why Yen Is The Most Important Chart For US Stocks
— 9/17/15
-
Is Silver Ready For Its Next Leg Lower?
— 9/16/15