

CHART OF THE WEEK: CABLE BULLS
Each week, I'll highlight a chart out of the Quid Report.
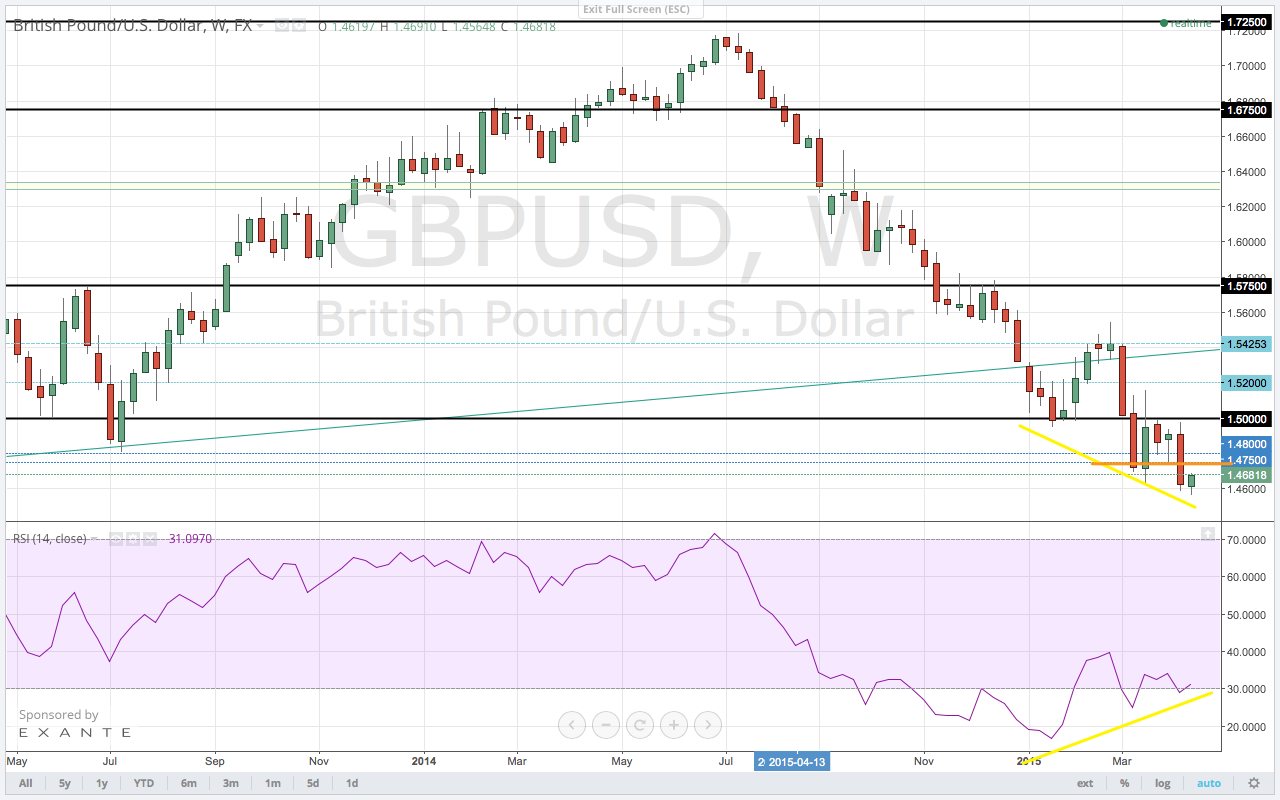
The bullish divergence on the $GBPUSD weekly chart has been developing all year long. This week's lows at the open and the subsequent rally have put yet another higher low on the weekly RSI. The bullish RSI divergence suggests, however, that price has the potential to return to the resistance level at 1.5000. Sellers are sure to step in at the major psychological level but can they hold off the bulls that having been building momentum all year?
This is an excerpt from this week's issue of Quid Report. Subscribers receive my research on all major GBP pairs at the top of the week, including access to @faithmightfx on Twitter for daily, real-time calls and adjustments to the weekly report. AVAILABLE NOW.
This is an excerpt from this week's issue of Quid Report. Subscribers receive my research on all major GBP pairs at the top of the week, including access to @faithmightfx on Twitter for daily, real-time calls and adjustments to the weekly report. AVAILABLE NOW.
Recent free content from Lydia Idem Finkley
-
 USD Leaves Markets in Suspense
— 6/15/16
USD Leaves Markets in Suspense
— 6/15/16
-
ECB Keeps Euro Happy
— 6/02/16
-
Cable is Breaking but Not Really
— 4/19/16
-
Remember, The Euro is a Safe Haven
— 4/17/16
-
NEW: The Monday Morning Calls
— 4/11/16
No comments. Break the ice and be the first!
Error loading comments
Click here to retry
No comments found matching this filter
-
{[comment.author.username]} {[comment.author.username]} — Marketfy Staff — Maven — Member
Want to add a comment? Take me to the new comment box!

- 1 Campus Martius, Suite #200Detroit, MI 48226
- +1 877 440 9464