

Beyond The Biotech Space - Michael Kors Holdings Limited (NYSE: KORS)
KORS gets caught in a wedge
Notice the declining wedge that I have outlined on the chart of KORS
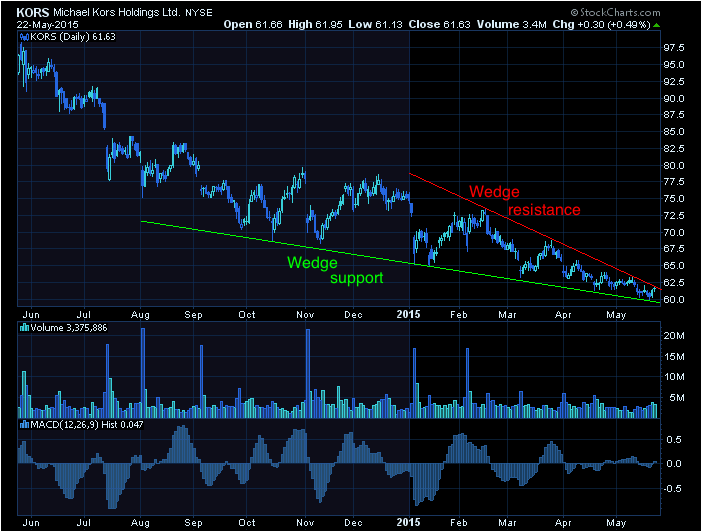
A declining wedge price pattern is essentially a type of triangle formation in which the stock (KORS) has formed a downtrending resistance line (red) and a downtrending support level (green). These two trend lines converging on one another combine to form a declining wedge, which is considered a bullish pattern.
Confirmation of this pattern would occur if the stock broke through the downtrending resistance.
The Tale of the Tape:
KORS has formed a declining wedge pattern, which should lead to higher prices for the stock if the pattern confirms. A long trade could be entered on a break above the wedge resistance with a stop placed below that level.
Before making any trading decision, decide which side of the trade you believe gives you the highest probability of success. Do you prefer the short side of the market, long side, or do you want to be in the market at all? If you haven’t thought about it, review the overall indices themselves. For example, take a look at the S&P 500. Is it trending higher or lower? Has it recently broken through a key resistance or support level? Making these decisions ahead of time will help you decide which side of the trade you believe gives you the best opportunities.
No matter what your strategy or when you decide to enter, always remember to use protective stops and you’ll be around for the next trade. Capital preservation is always key!
Good luck!
The Biotech Trader
@TraderBiotech
Recent free content from Christian Tharp, CMT
-
 Biotech Breakdown: Positive Signs Are Building (11/25/15)
— 11/25/15
Biotech Breakdown: Positive Signs Are Building (11/25/15)
— 11/25/15
-
Biotech Breakdown: Market Still Pulling Back (11/12/15)
— 11/12/15
-
Biotech Breakdown: Market Pullback Before New Highs (11/6/15)
— 11/06/15
-
Biotech Breakdown: Market Correction Over? (10/22/15)
— 10/23/15
-
Biotech Breakdown: Markets Up, Biotechs Finally Take Part (10/16/15)
— 10/16/15