

CHART OF THE WEEK: FAILURE MEANS SOMETHING
Each week, I highlight a chart out of the Quid Report.
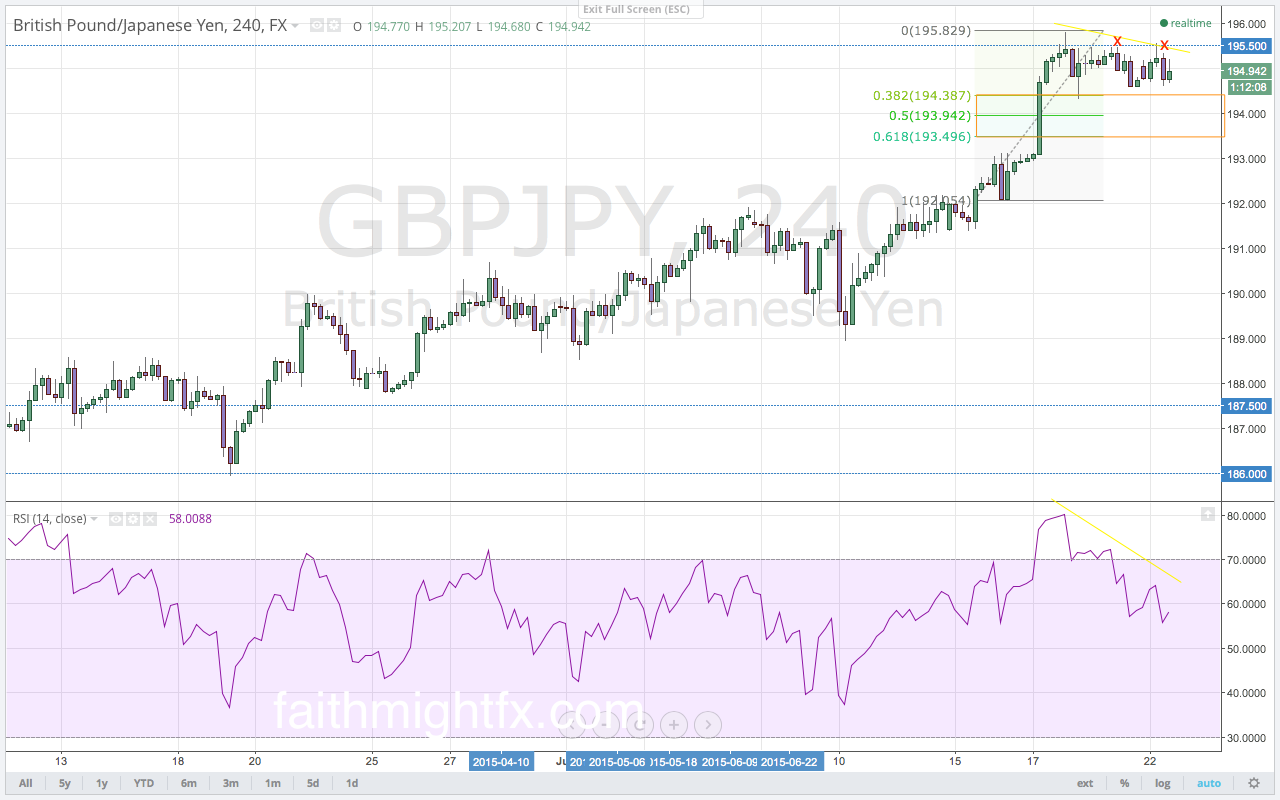
The $GBPJPY failed above the 195.50 resistance level all week. Now that $GBPJPY has moved lower off these highs this week, is it now ready to break higher?
This is an excerpt from this week's issue of Quid Report. Subscribers receive my research on all major GBP pairs at the beginning of the week, including access to @faithmightfx on Twitter for daily, real-time updates to the weekly report. AVAILABLE NOW.
This is an excerpt from this week's issue of Quid Report. Subscribers receive my research on all major GBP pairs at the beginning of the week, including access to @faithmightfx on Twitter for daily, real-time updates to the weekly report. AVAILABLE NOW.
Recent free content from Lydia Idem Finkley
-
 USD Leaves Markets in Suspense
— 6/15/16
USD Leaves Markets in Suspense
— 6/15/16
-
ECB Keeps Euro Happy
— 6/02/16
-
Cable is Breaking but Not Really
— 4/19/16
-
Remember, The Euro is a Safe Haven
— 4/17/16
-
NEW: The Monday Morning Calls
— 4/11/16
No comments. Break the ice and be the first!
Error loading comments
Click here to retry
No comments found matching this filter
-
{[comment.author.username]} {[comment.author.username]} — Marketfy Staff — Maven — Member
Want to add a comment? Take me to the new comment box!

- 1 Campus Martius, Suite #200Detroit, MI 48226
- +1 877 440 9464