

Weekend Review and Watchlist
Overview
Equity markets experienced another volatile week with the major indices undergoing a partial retest of the August lows, culminating in the biggest intraday swing in 4 years to finish the week higher.
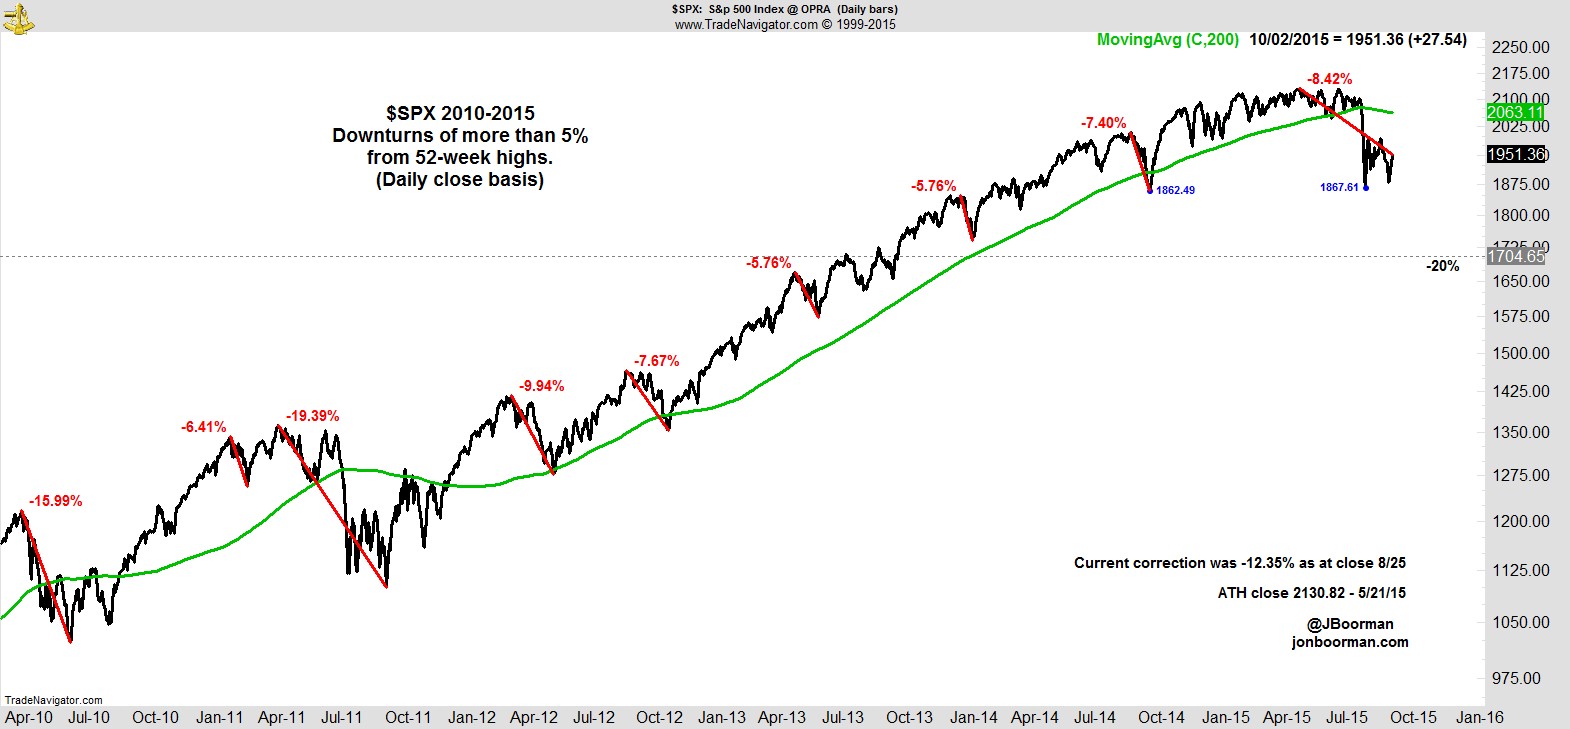
The S&P now sits 8.4% off its highs having reached -12.4% on a closing basis in late August. It looked all set to test those levels as the week got underway, with a broad sell-off that saw biotech again leading the decline, before it steadied to post four straight days of gains, the first such instance since the halcyon days of July when all time highs looked inevitable.
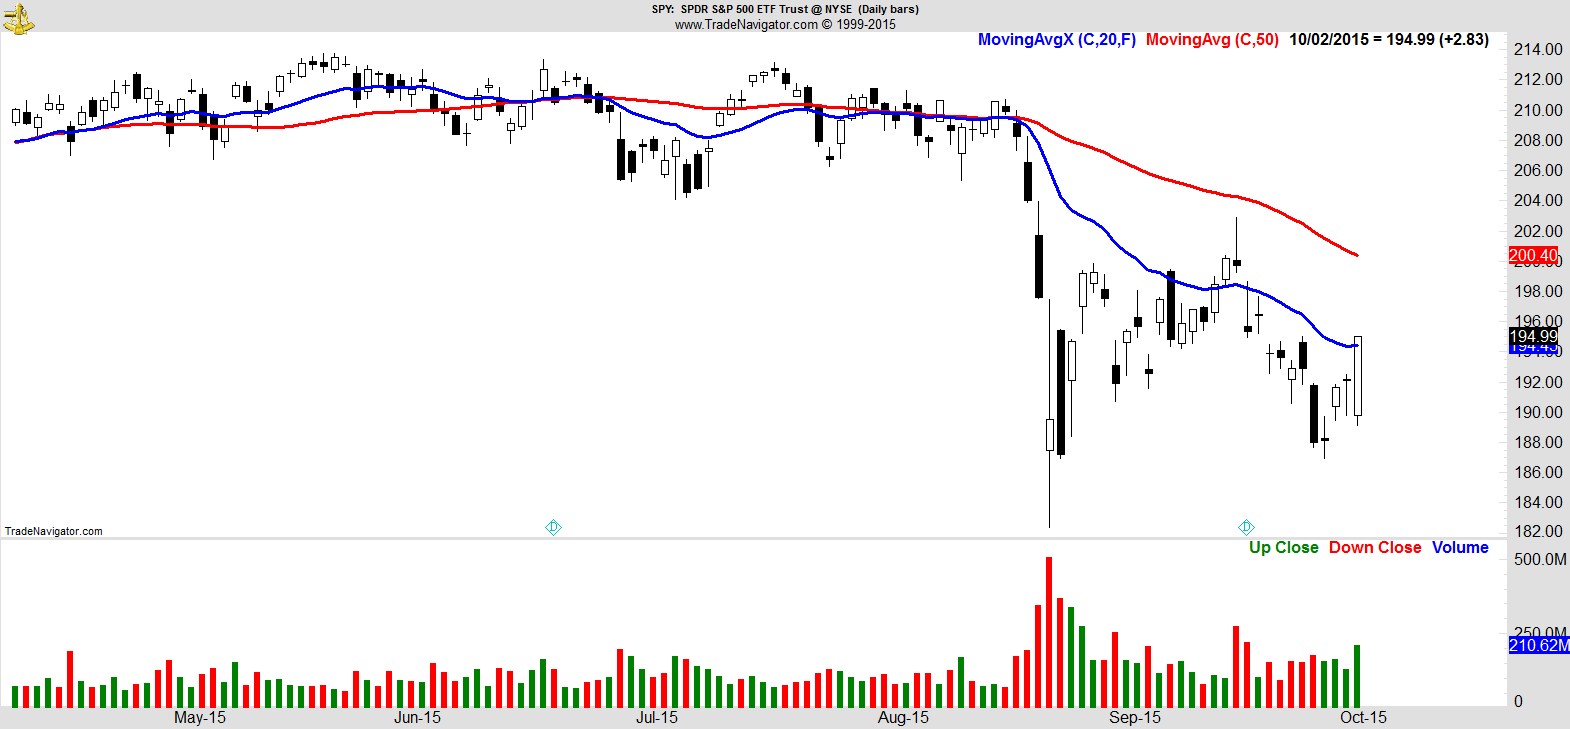
Much will be made of the high-volume rally into the weekend (shown above via $SPY) and the candle formation it leaves in place - traditionally seen as a bullish indicator - but we've been here before.
If we turn to a weekly chart we can see that 'hammer' formation on this week's bar. We heard much the same chatter after the rally from the lows in August. Back then, a huge reversal higher resulted in a small gain on the week, the 'flash-crash' trades of that Monday's open were quickly written-off as an aberration and higher prices were readily anticipated. We're still waiting.
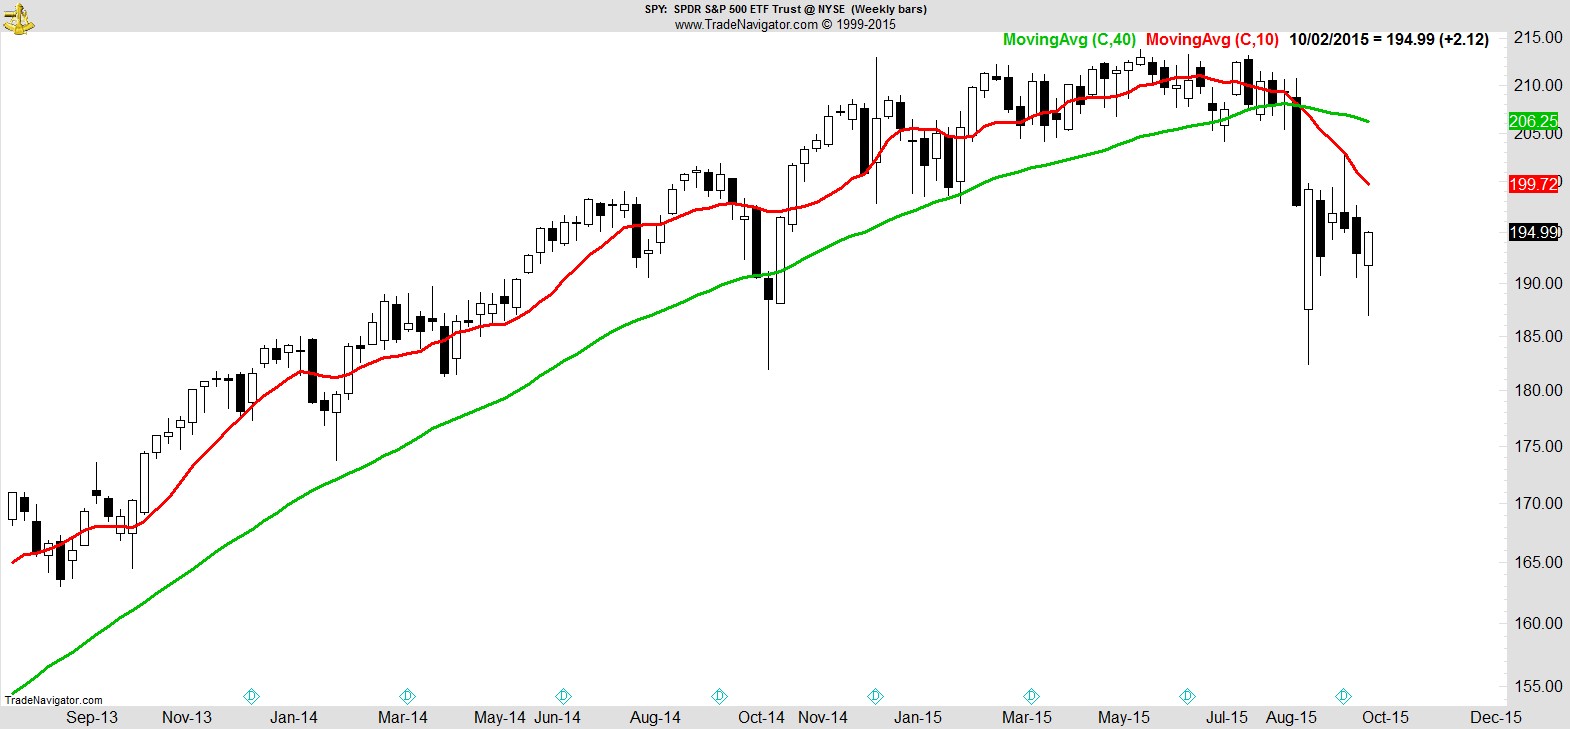
As much as I personally like to use candle charts to help eyeball the volatility and context of that bar's range, I'm a little wary of giving any weight to those kind of patterns or formations on a longer timeframe. It's my belief candle formations may be useful on a very short-term basis, perhaps as a supporting tool for an entry signal for example, but that's a topic for another day.
My reason for bringing it up here is I often like to cast an eye over a simple line chart for additional context, and the $SPY chart below demonstrates why. Friday's move was certainly powerful, but look at the weekly line chart below compared to the candle chart above and it looks like we've wasted an awful lot of fuel going nowhere for a month.
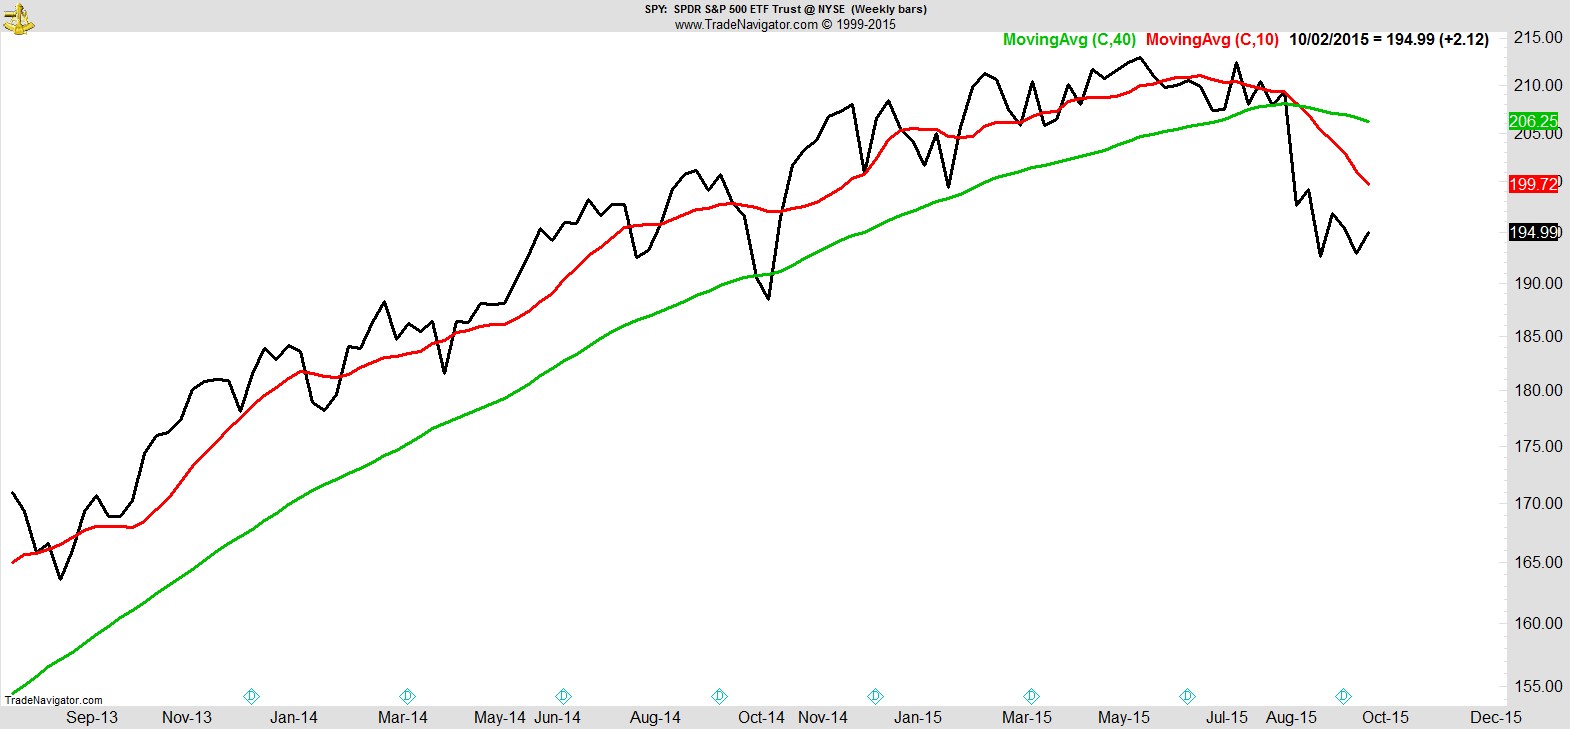
That's the kind of price action that saps energy and confidence, and can result in obvious stops at the edge of the range that have the potential to trigger short-squeezes and air-pocket moves lower. In short, not a healthy market environment. And that huge candle from the end of August? It barely registers on the line chart, it's a tiny blip higher, and it's a level we haven't held since.
Although this week could be seen as a successful defense of the August lows for the S&P, that wasn't the case everywhere. The Russell 2000 ($RUT) extended its losing streak this week to eight sessions to reach fresh lows.
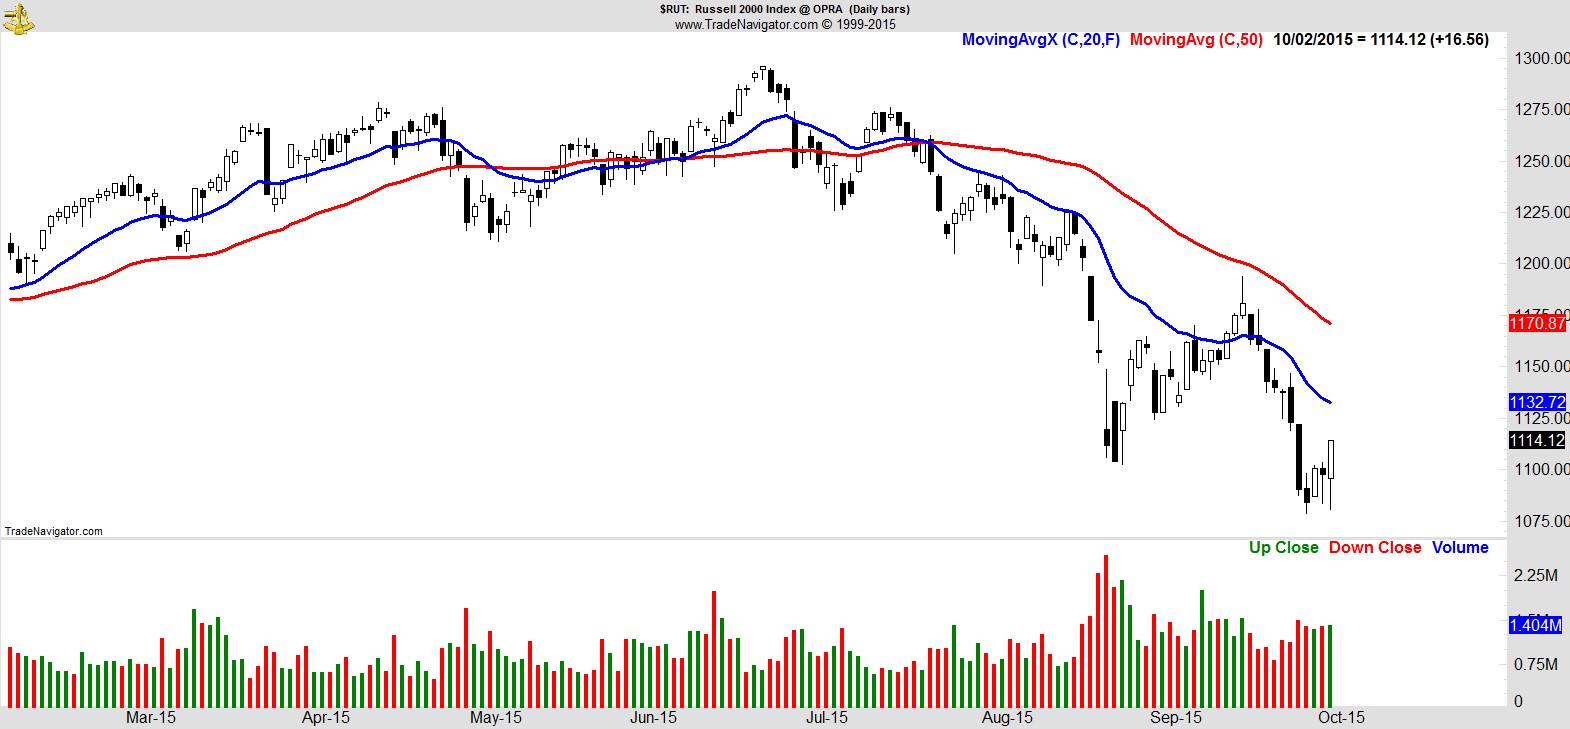
.
The extent of that weakness can also be seen here relative to the $SPX:-
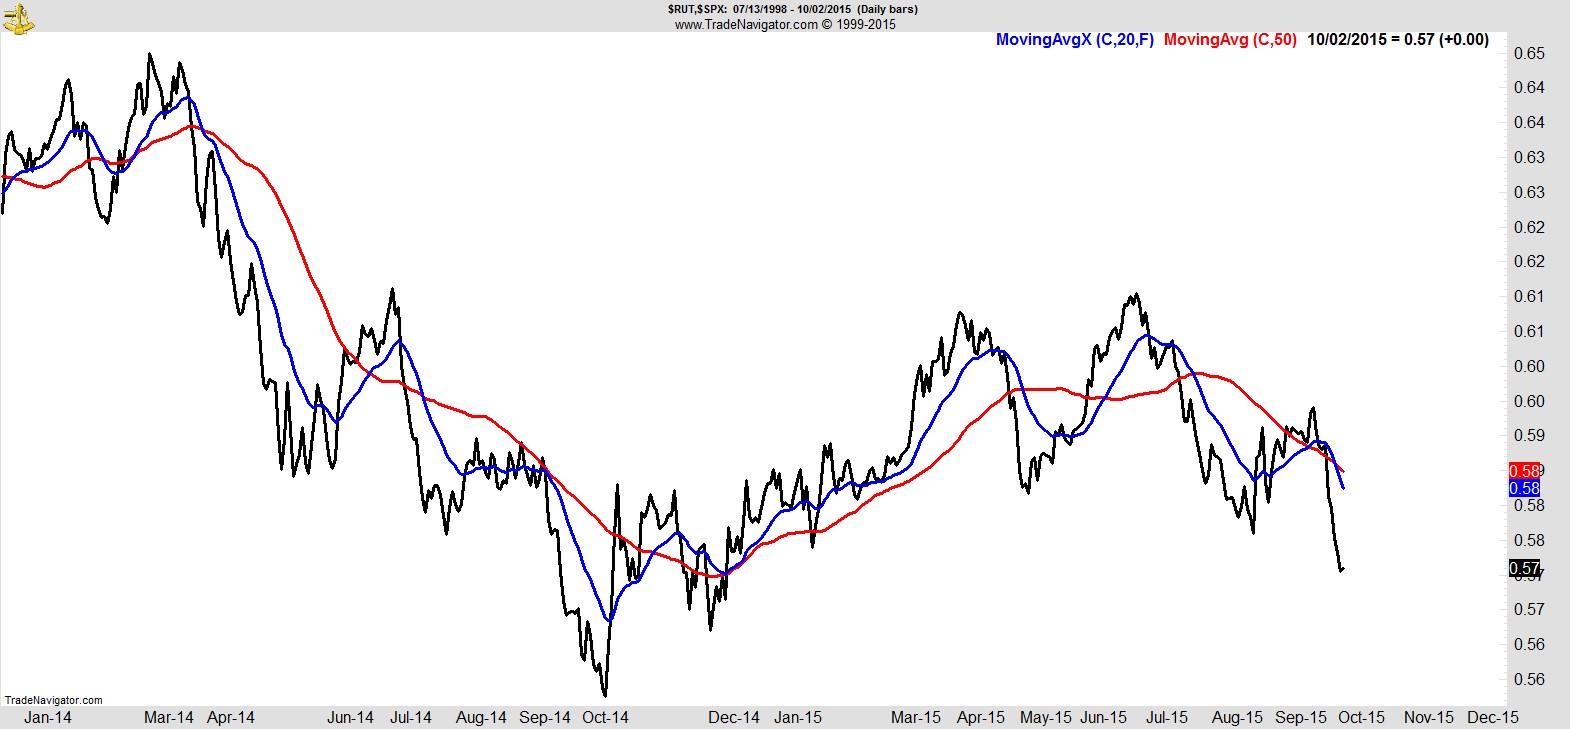
.
It was a similar story for biotech, shown here via $IBB, which hit 11-month lows and even managed to test the intraday 'flash-crash' levels of August 24th.
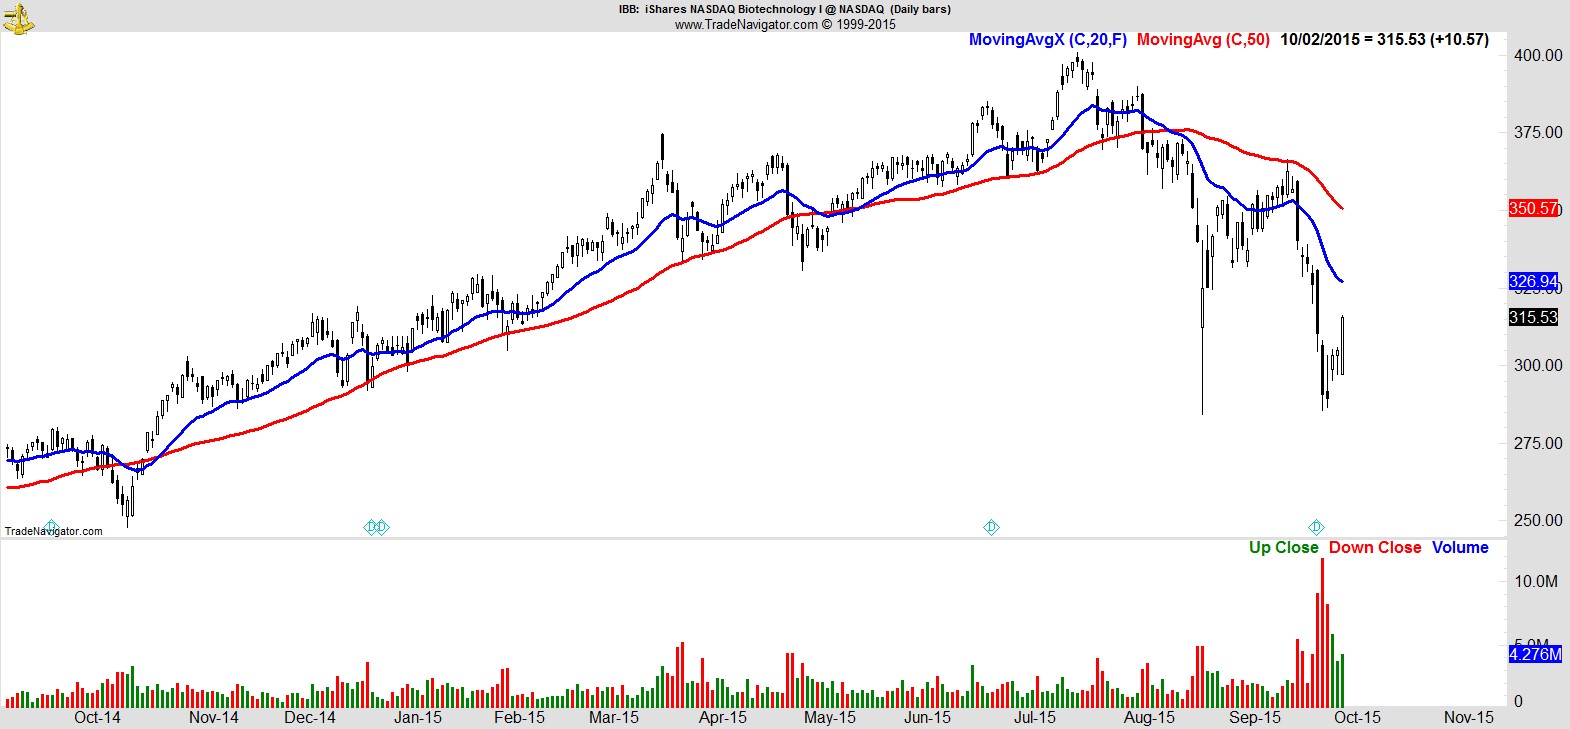
.
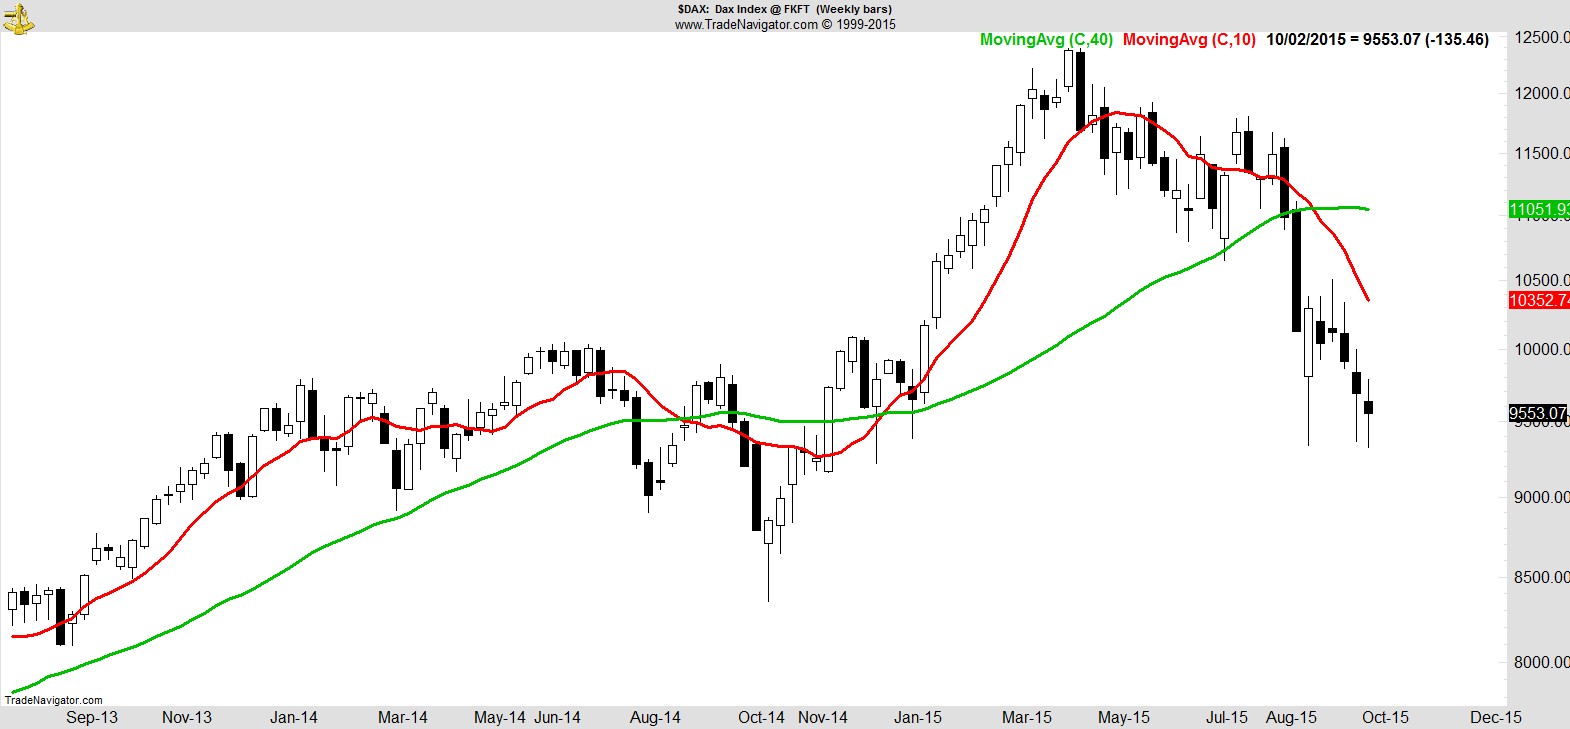
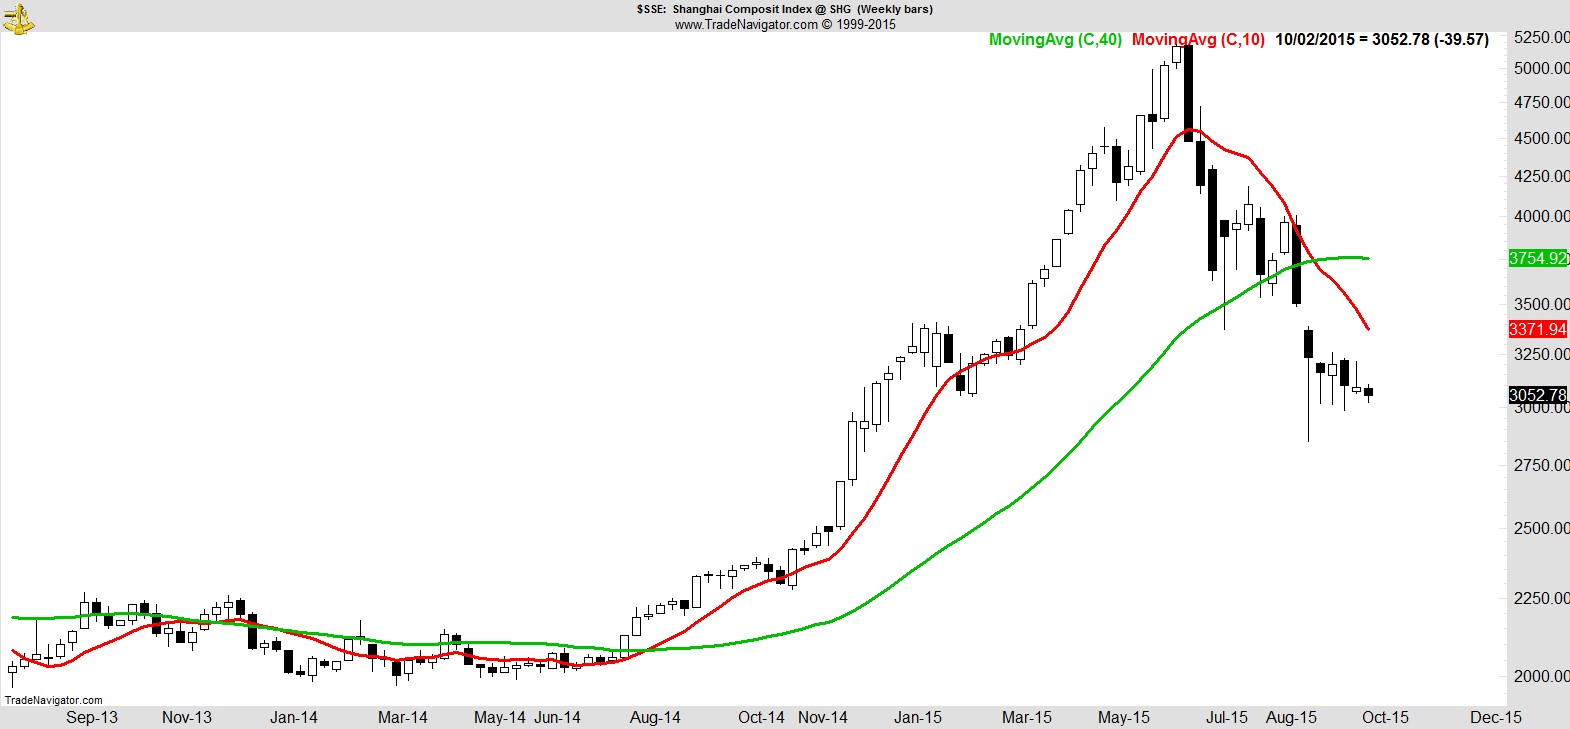
Finally, looking beyond the US, although they won't have been able to fully factor in Friday's late afternoon surge, Japan, Germany, and China all closed at fresh weekly lows.
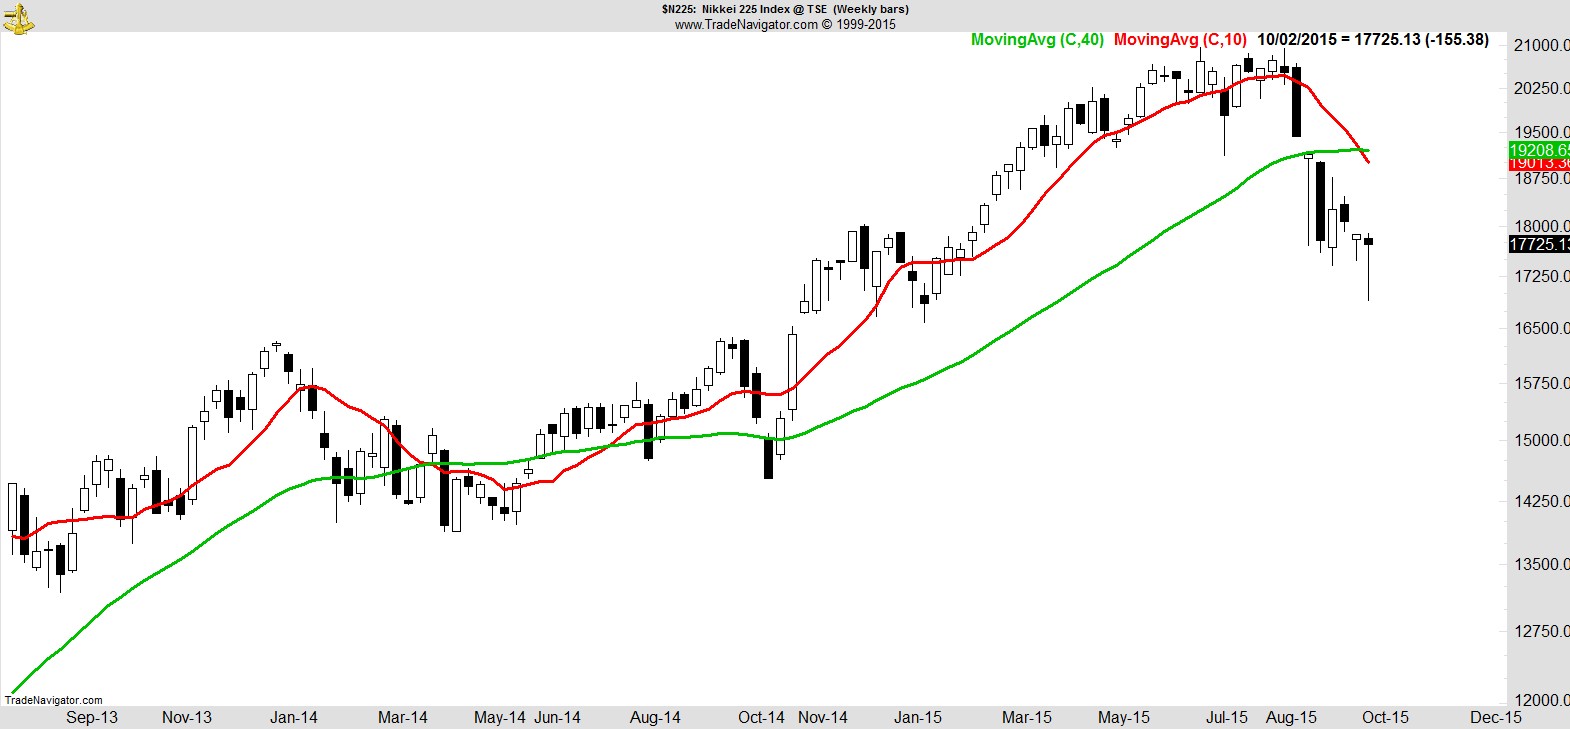
.
Alpha Capture Portfolio
We started the week taking exit signals from the previous Friday that left us with just two names and over 90% in cash. Later in the week we had one further exit to leave us with a single portfolio name. We also have three trade ideas that remain active.
Our portfolio edged -0.6% on the week vs +1.0% for the S&P.
That takes it to -2.3% YTD vs -5.2% for the S&P.
Clearly, with so much in cash, although we've seen little change in our absolute performance over the last five weeks, in relative terms it becomes much more accentuated day to day. Friday's session also demonstrated that with little or no exposure to stocks you can still find yourself exposed to the fear of missing out!
As we saw in the charts earlier however, despite Friday's reversal and the higher close on the week, this remains a highly volatile environment with very few strongly-trending stocks for us to consider. A lot more time may be needed for truly constructive price action to emerge. Until then we remain protected from further downside, and ready to act when conditions improve and opportunities that meet our criteria start to arise.
.
Sector Overview
Consumer Discretionary ($XLY) remains the strongest of the S&P sector SPDRs, reclaiming ground above its still-rising 200-day MA.
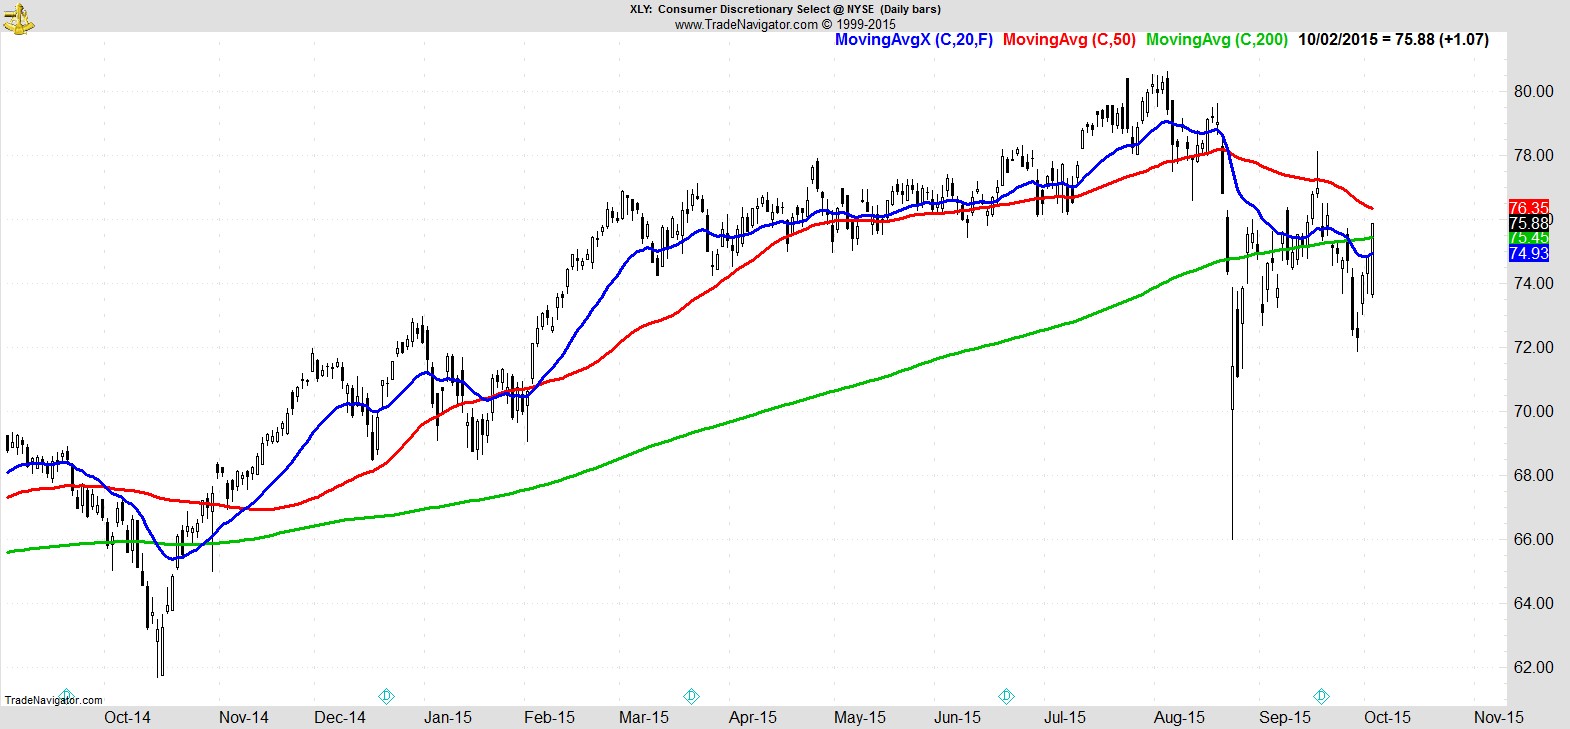
I believe this sector can play a major role in determining what's next for this market. It's been remarkably resilient on a relative basis and is now finely poised, above its 200-day with a higher low in place, but also with resistance at lower highs to overcome.
It's possible as last-man standing it somehow continues to lead the recovery and drags this market higher, or leadership emerges elsewhere, but we've already seen some cracks starting to appear in some major consumer names, and if that were to become more widespread I think it could trigger a new wave of selling significant enough to take the overall market to new lows.
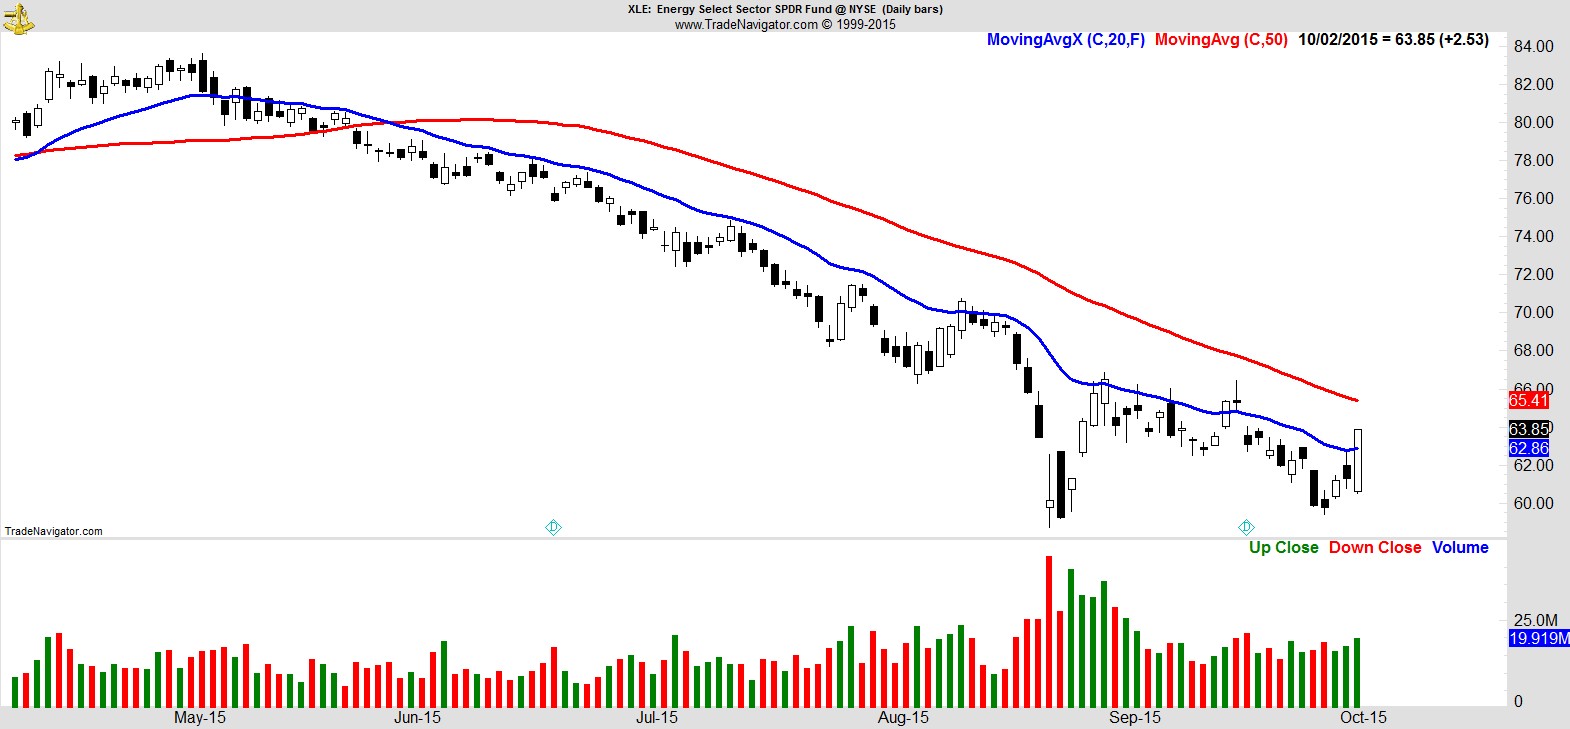
Energy ($XLE) had a good week, moving above its 20EMA and leaving a higher low in place. Obviously there is a long long way to go, and that is one solid downtrend, but eventually this sector will recover, and this week's action was another attempt at a start.
.
Technology ($XLK) also managed to reclaim its 20EMA, led in part by strength in Semiconductors, shown here via $SMH.
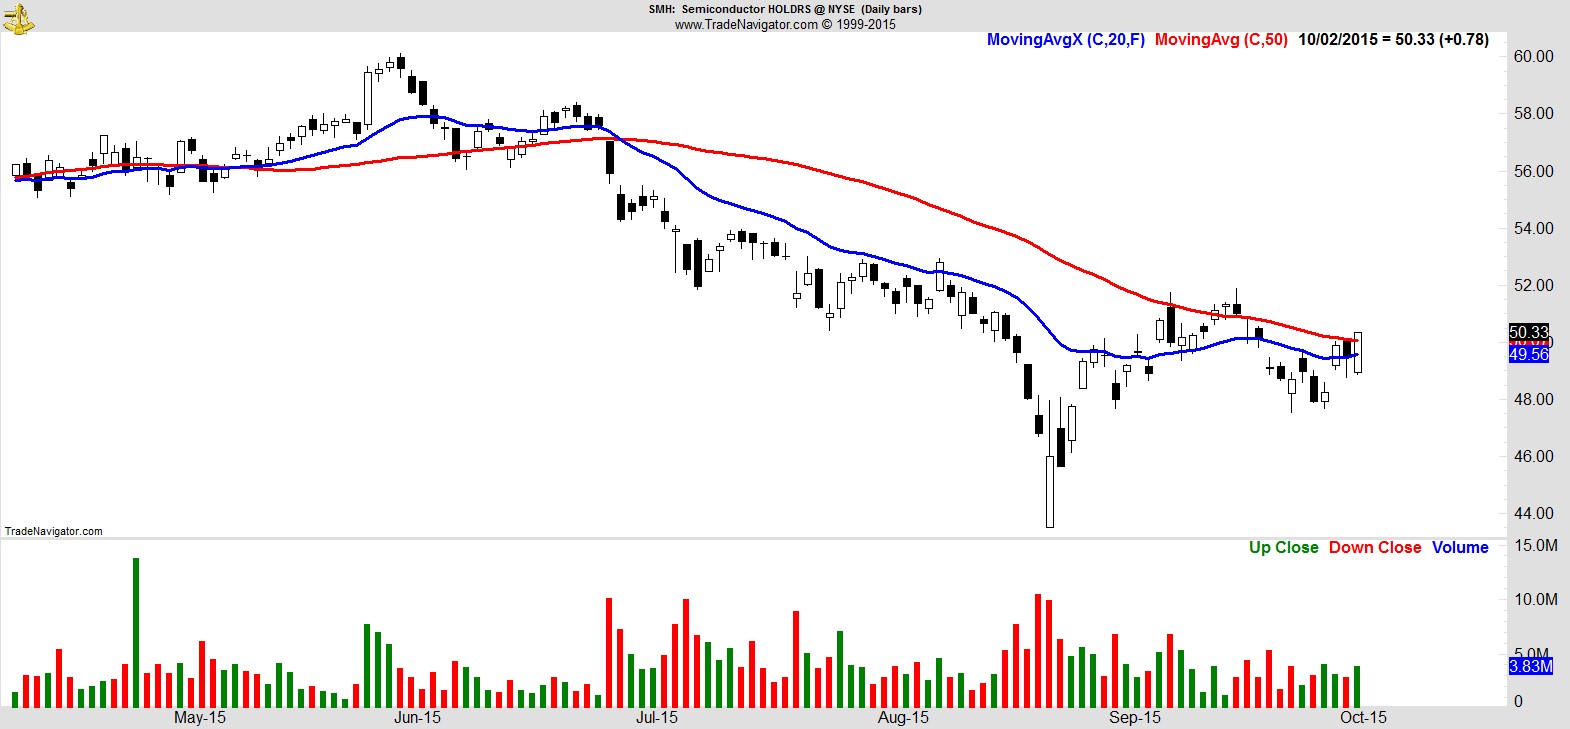
.
Watchlist
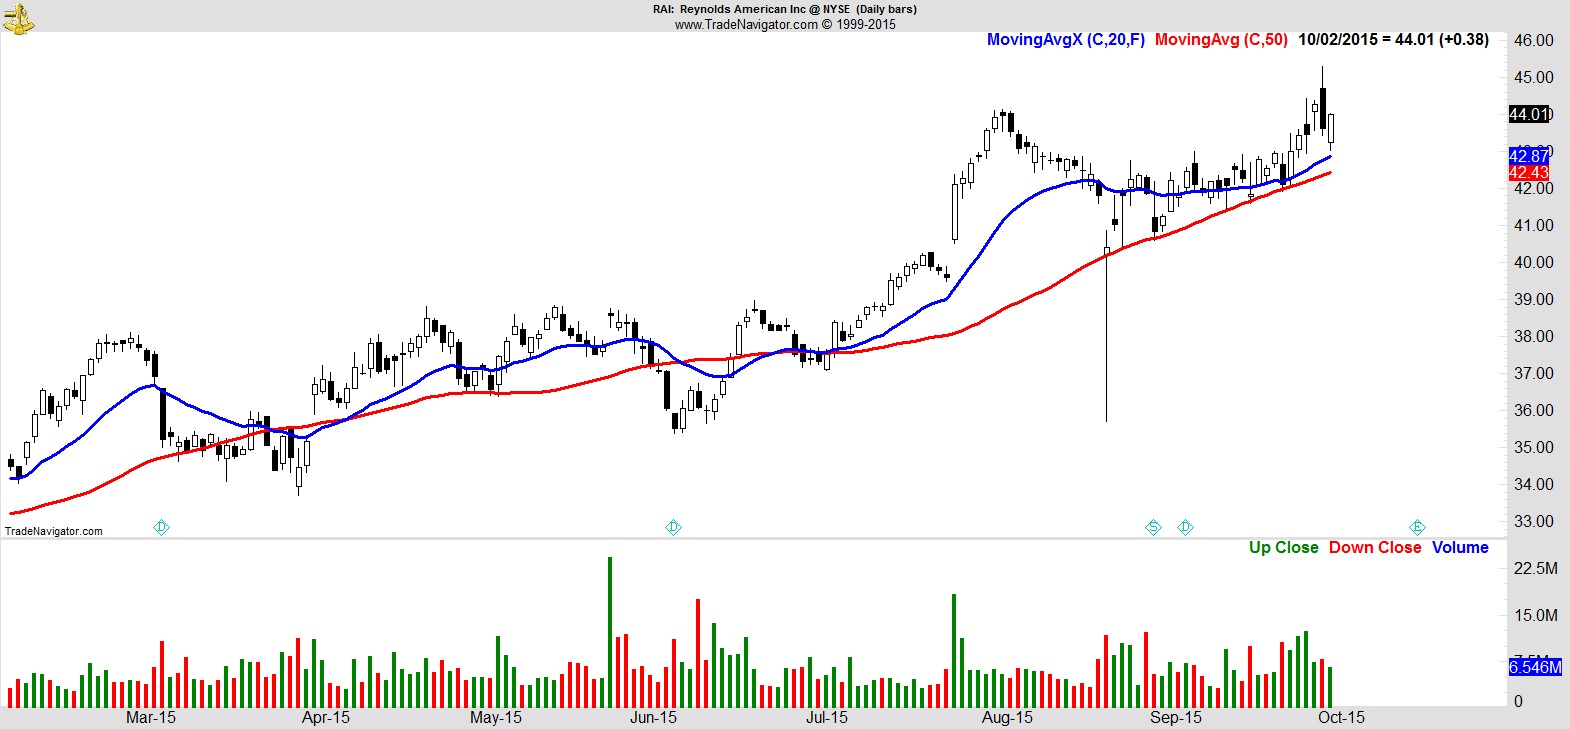
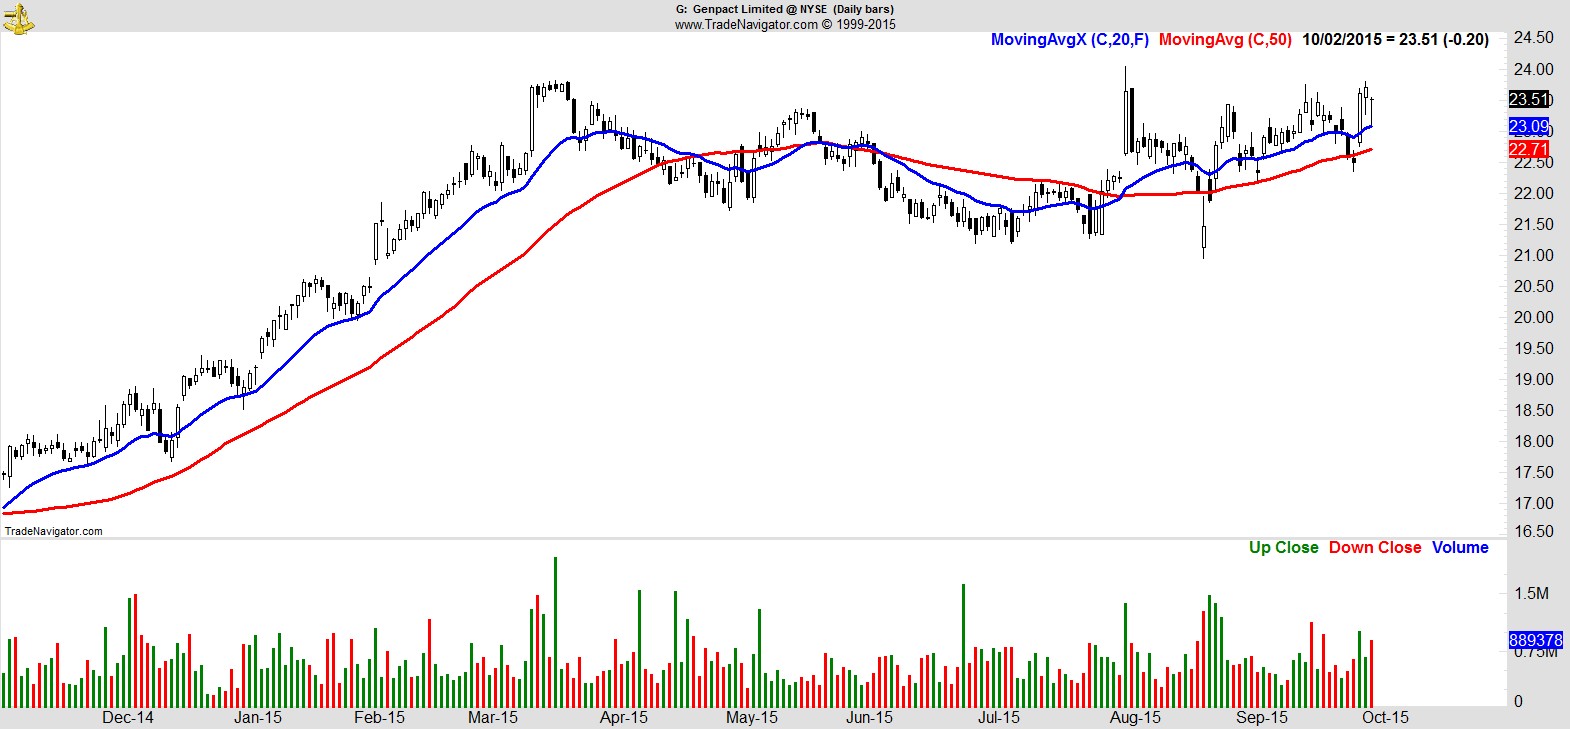
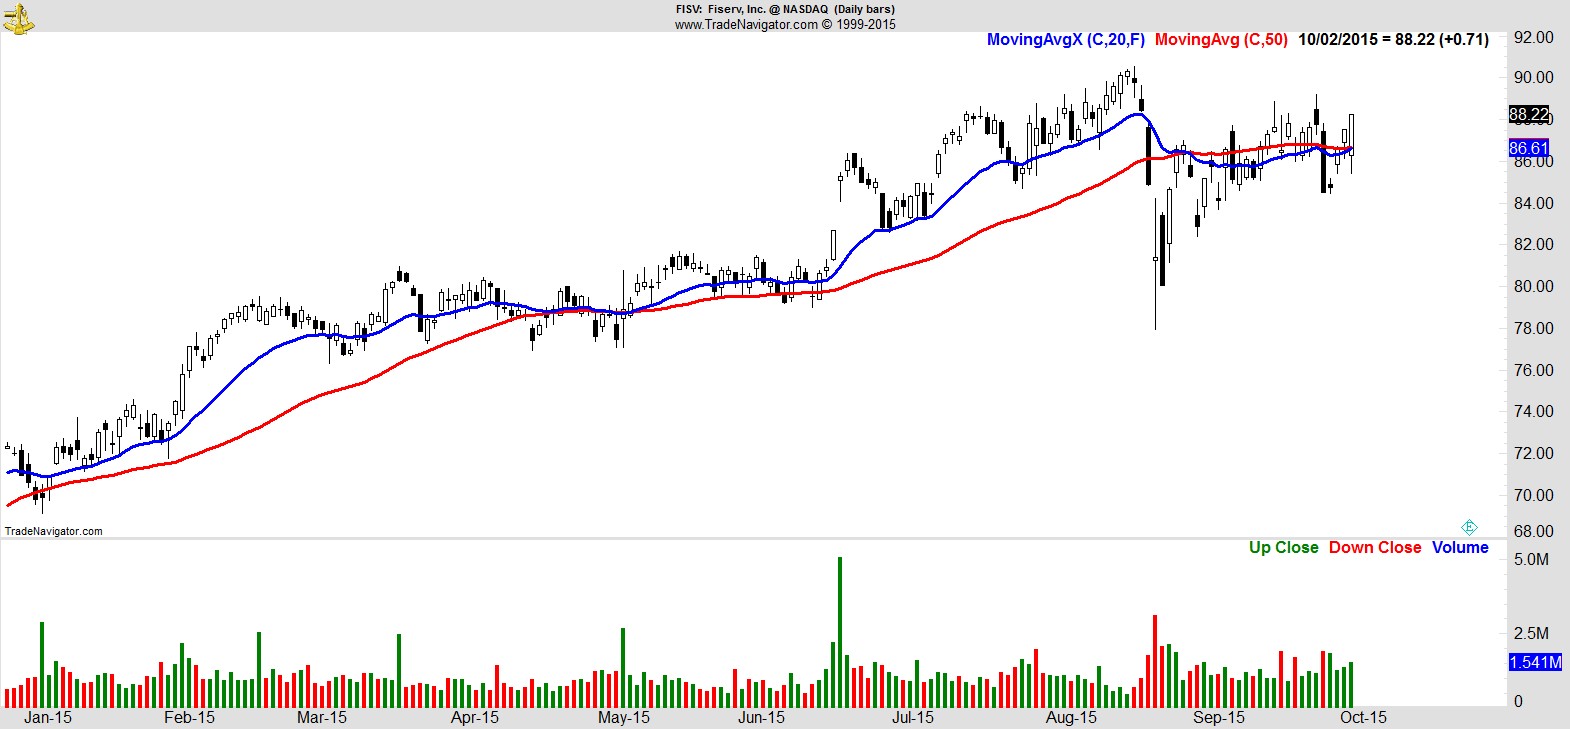
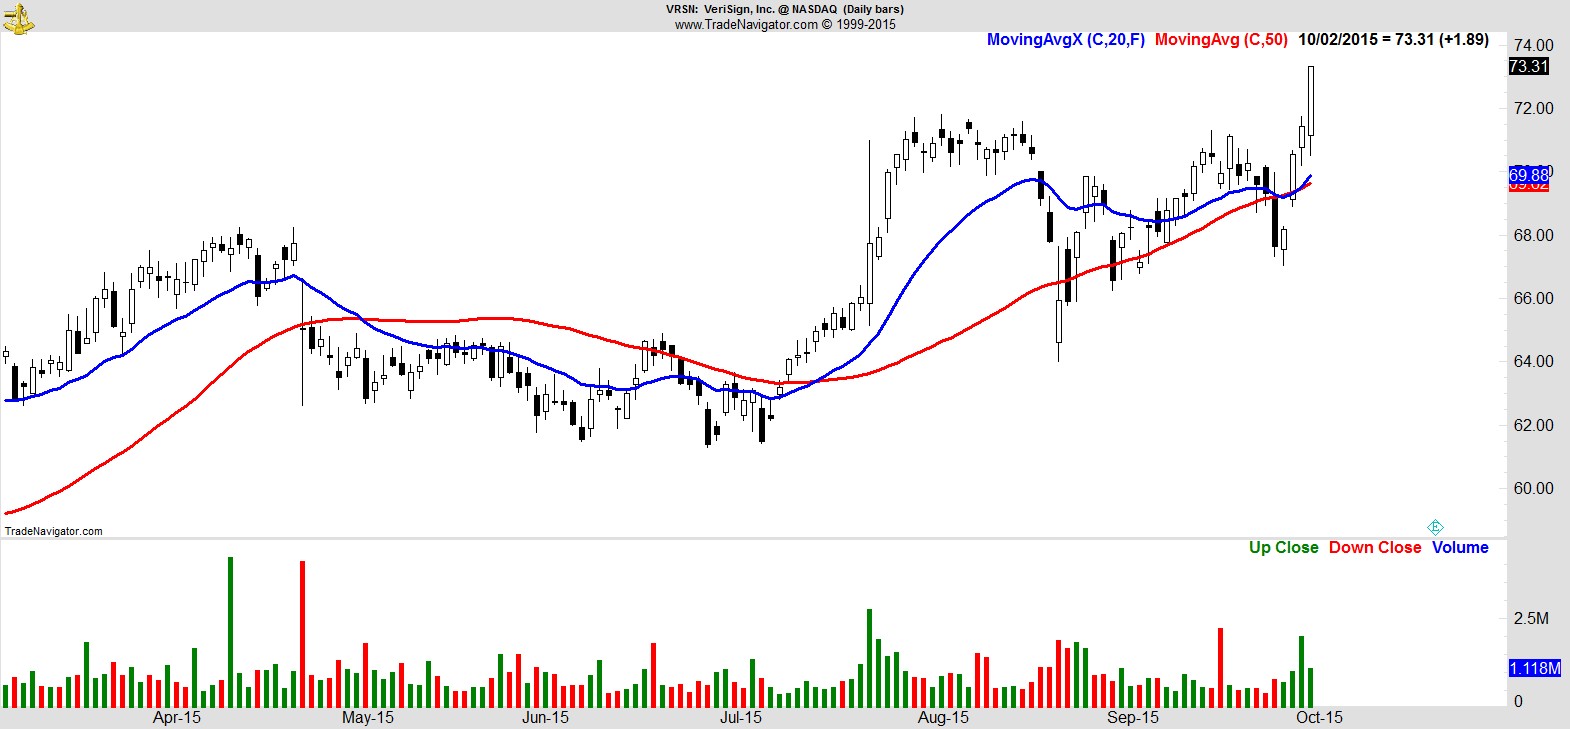
As mentioned previously our watchlist continues to be dominated by consumer names, but within that there's a noticeable tilt towards staples, with a few food and tobacco names showing strongly. Business services and payments also look good. Beyond that, a couple of technology names have emerged but there's nothing from healthcare, energy or materials for our timeframe.
Here's a sample of 8 from the full list of 22 names:-
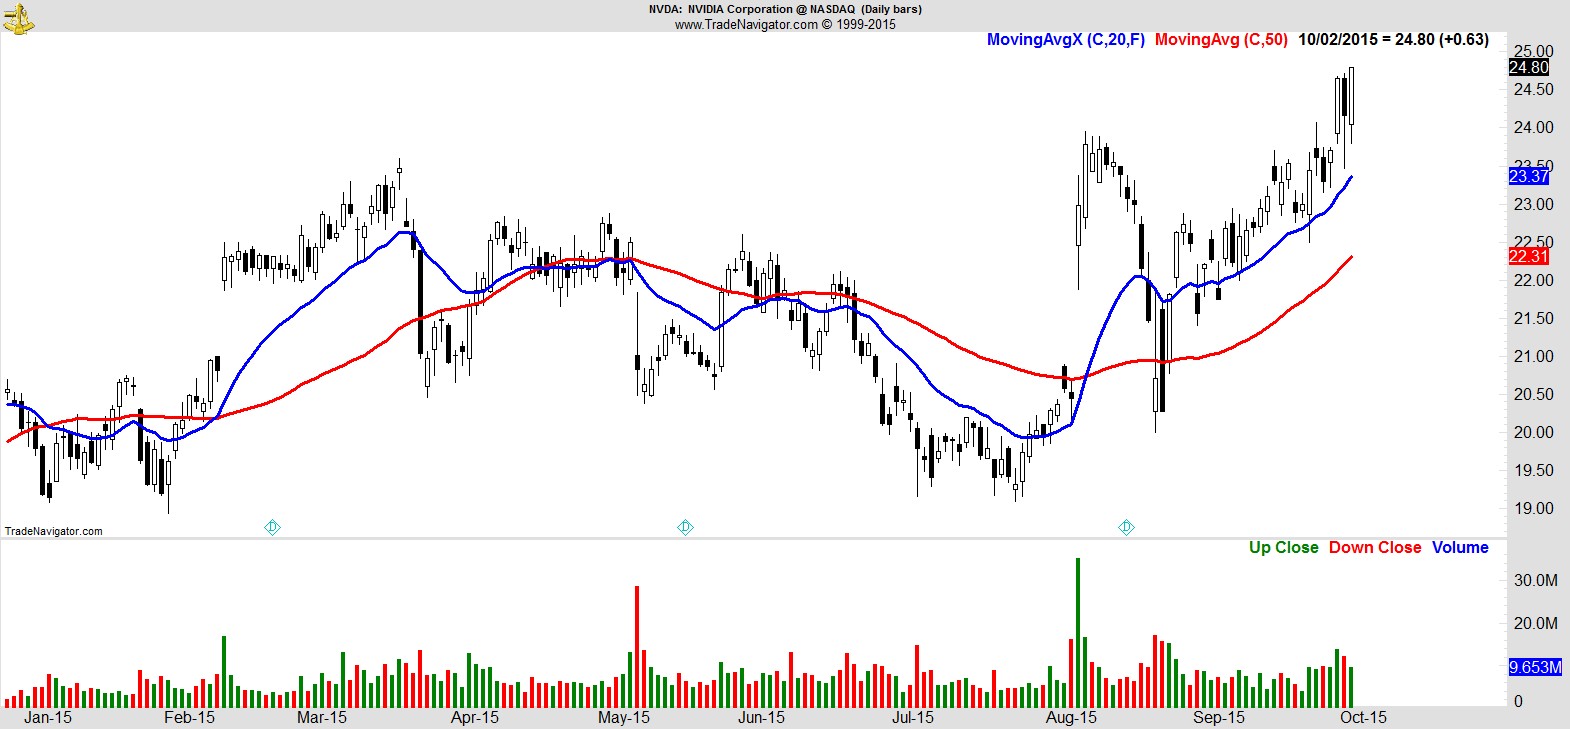
$NVDA
.
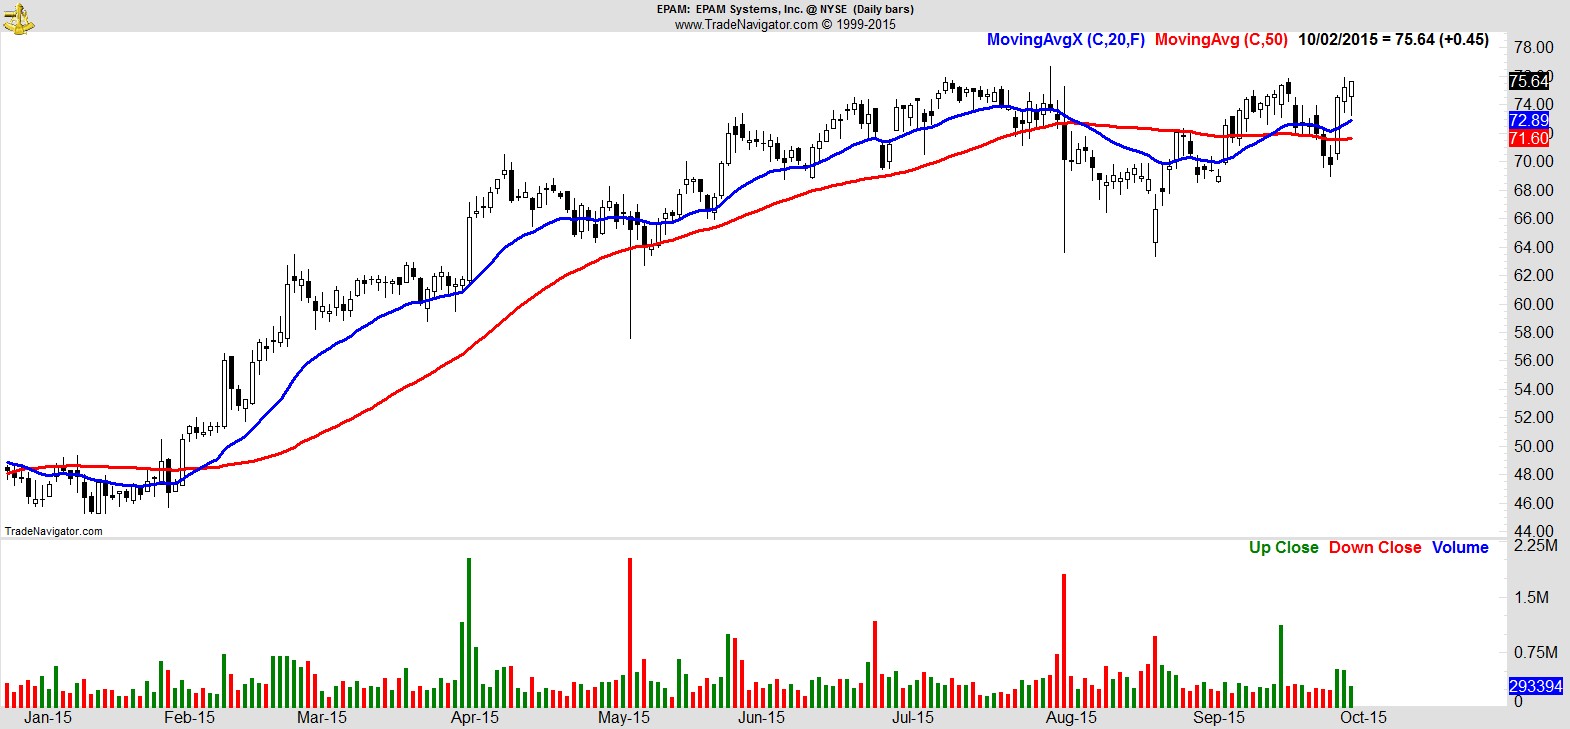
$EPAM
.
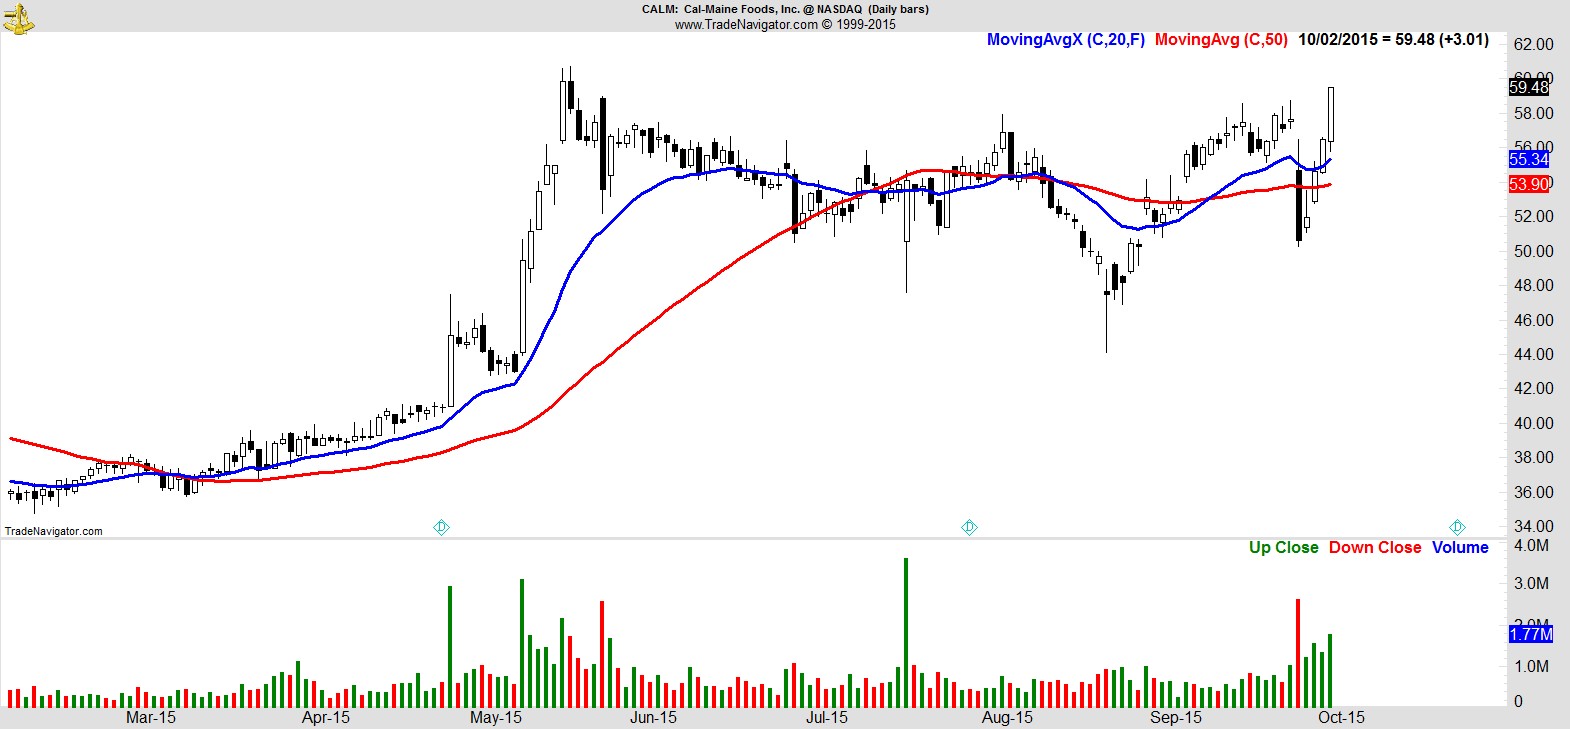
$CALM
.
$RAI
.
$G
.
$FISV
.
$VRSN
.
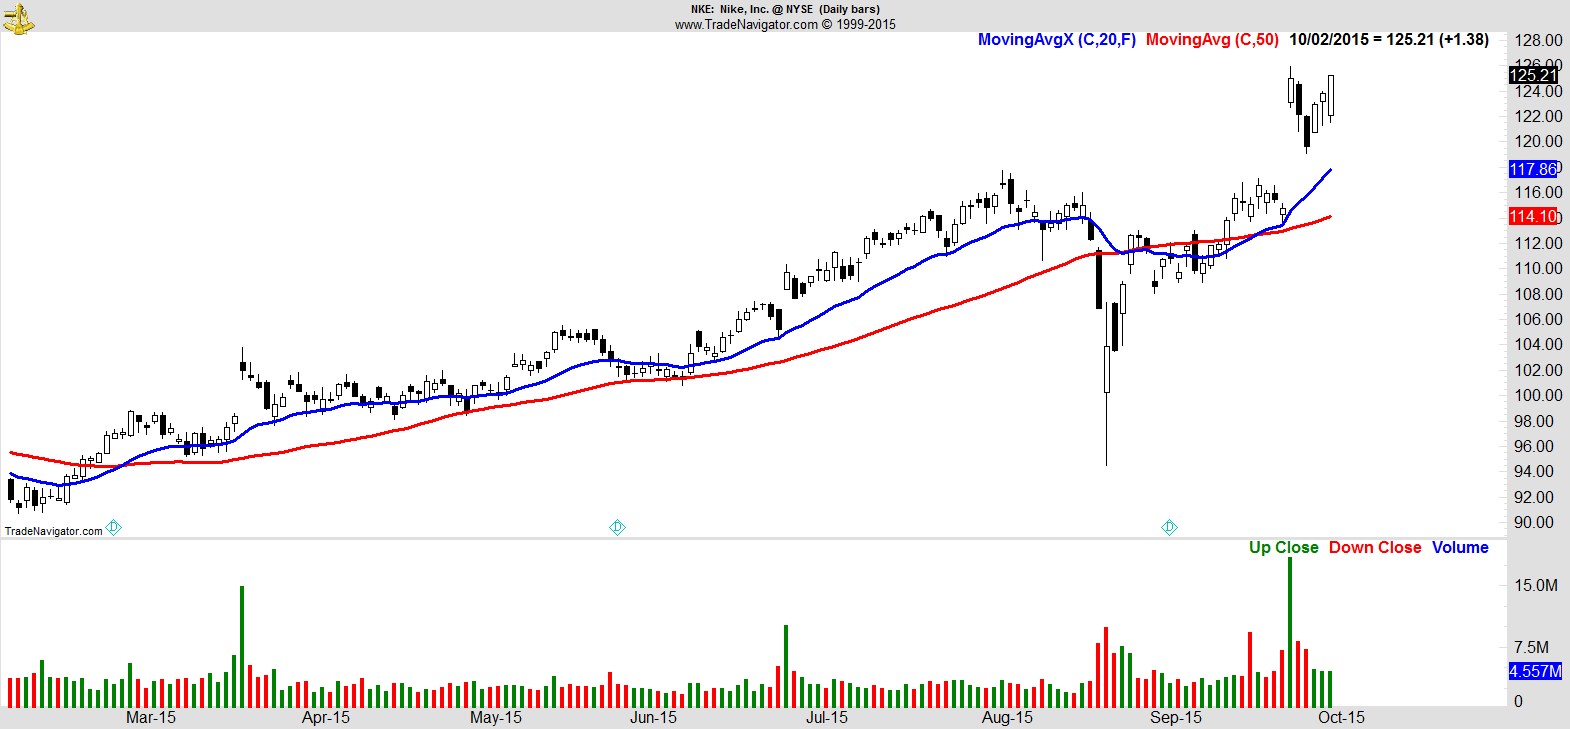
$NKE
.
Recent free content from Jon Boorman
-
 Weekend Review and Watchlist
— 9/30/17
Weekend Review and Watchlist
— 9/30/17
-
Weekend Review and Watchlist
— 9/22/17
-
Weekend Review and Watchlist
— 9/17/17
-
Weekend Review and Watchlist
— 9/10/17
-
Weekend Review and Watchlist
— 9/02/17