

Weekend Review and Watchlist
Overview
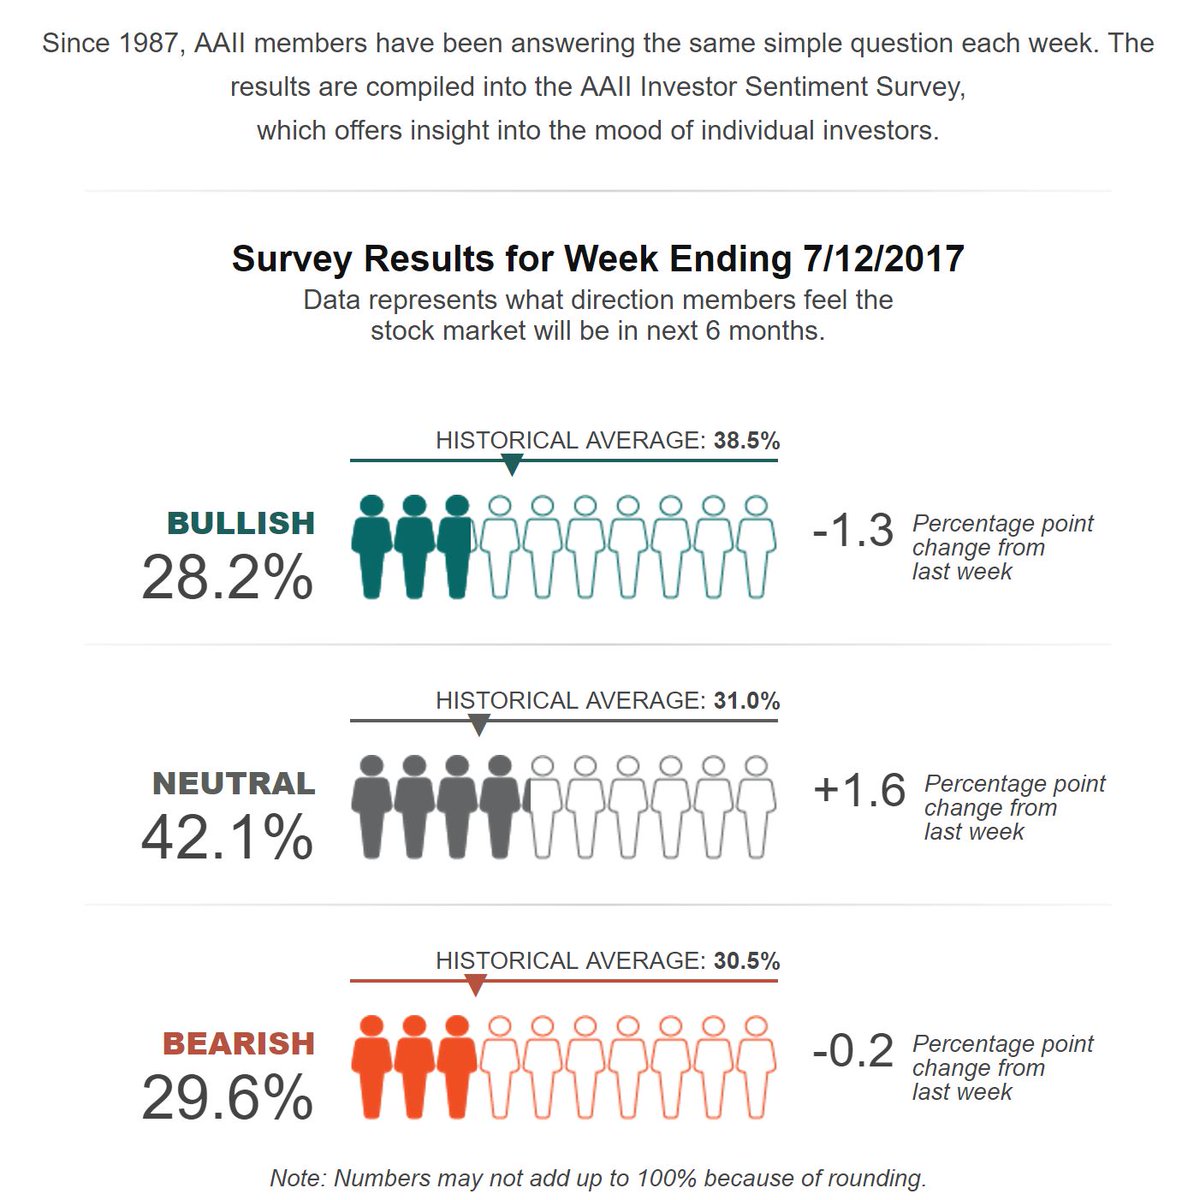
US equities are at all time highs. Breadth is too. Far from showing complacency, bullish sentiment is at the bottom of its normal range. The current bull market is now one year old and looks to be in good shape.
Here is the S&P on a daily and weekly chart:-
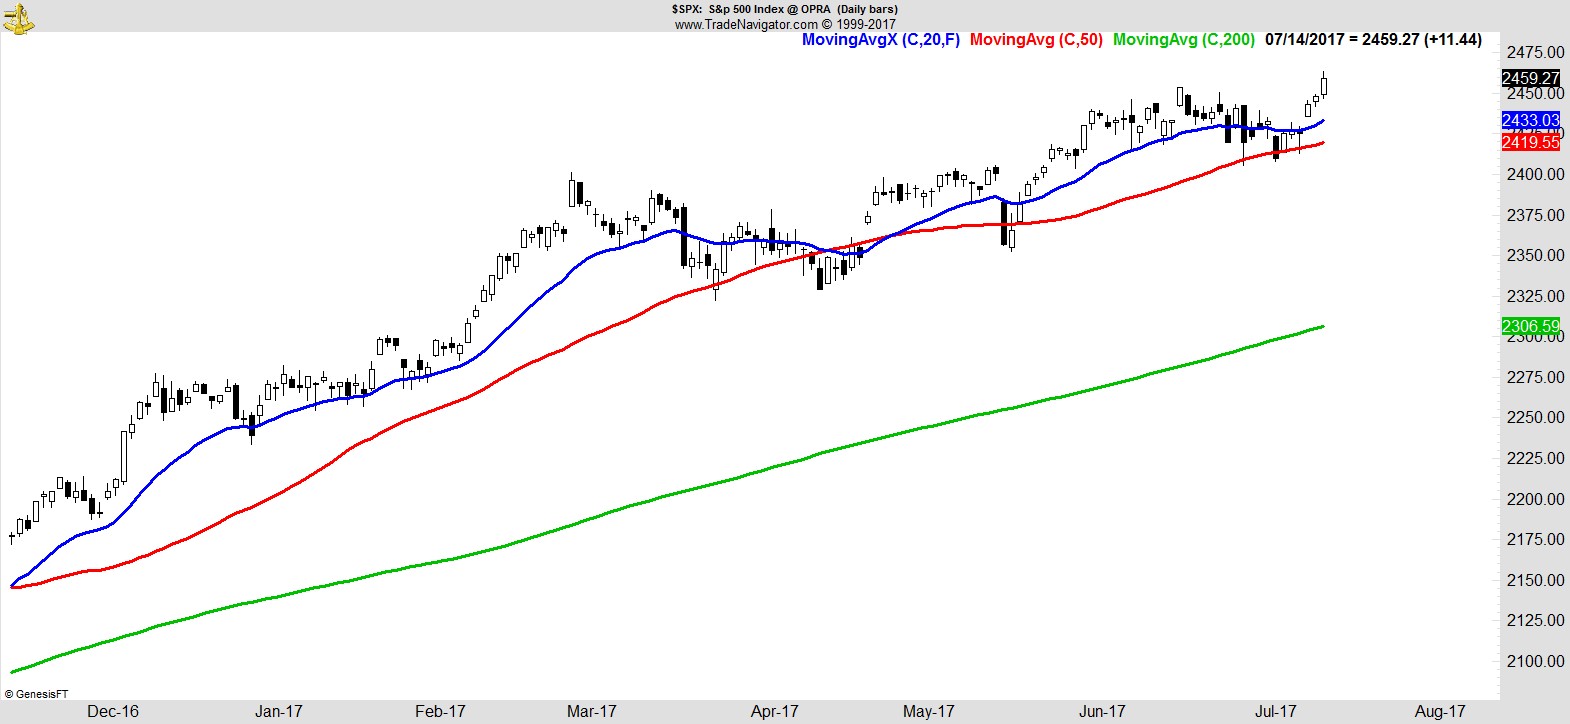
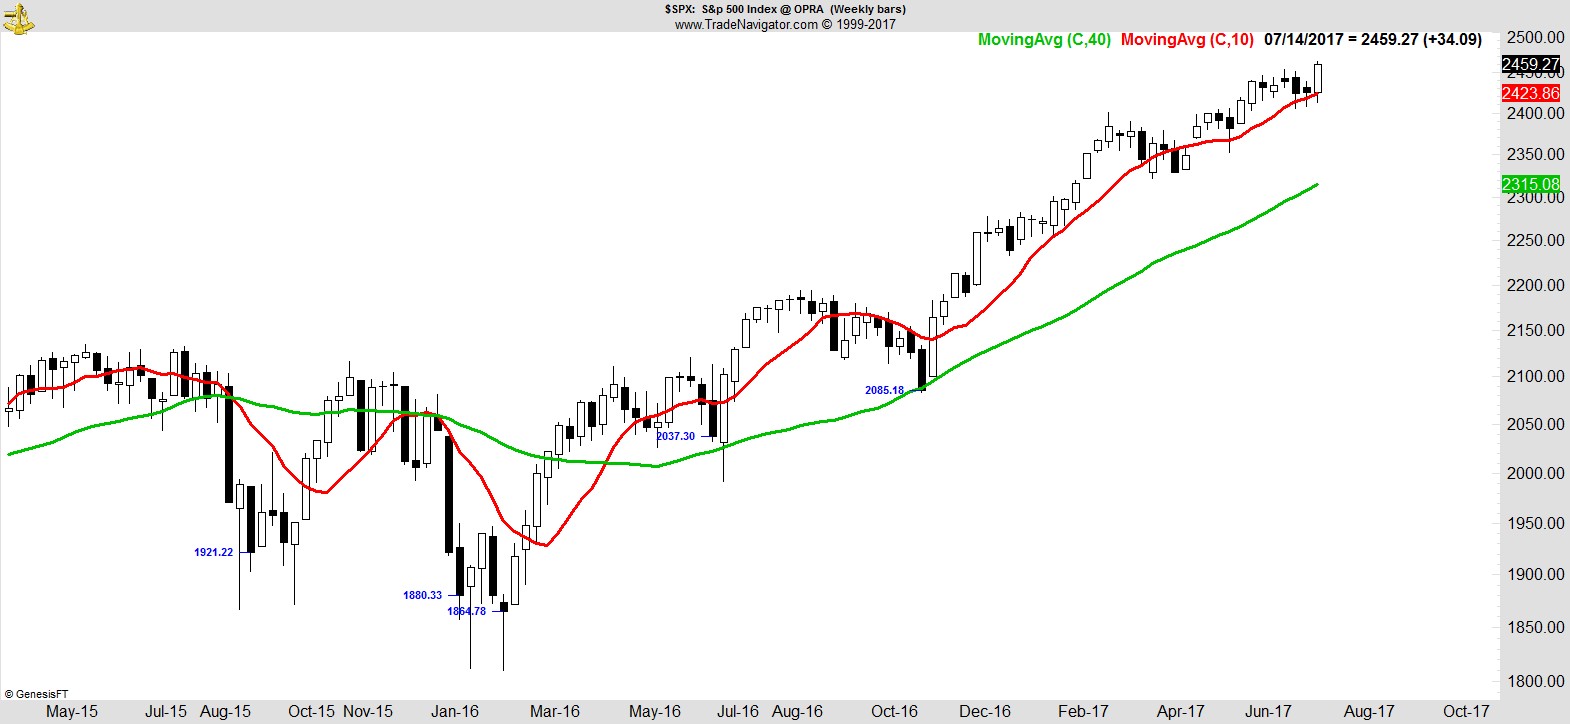
In addition, the Dow, NYSE Composite, Dow Transports, and Russell, all made all time highs on a daily and weekly basis. The NASDAQ, Midcaps, and Microcaps, made all time highs on a weekly close basis.
The bull market that began in July 2016 is now one year old.
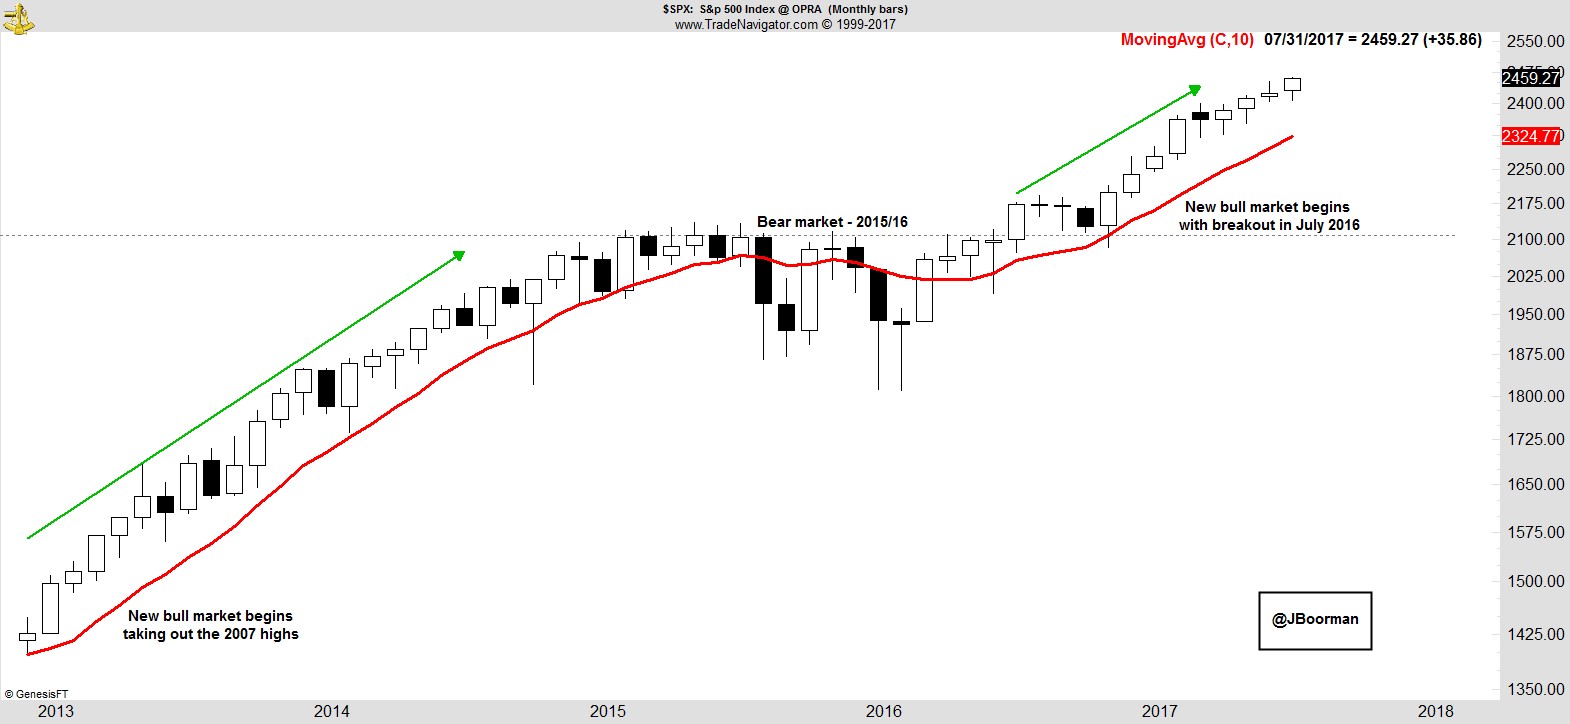
.
Breadth is at all time highs.
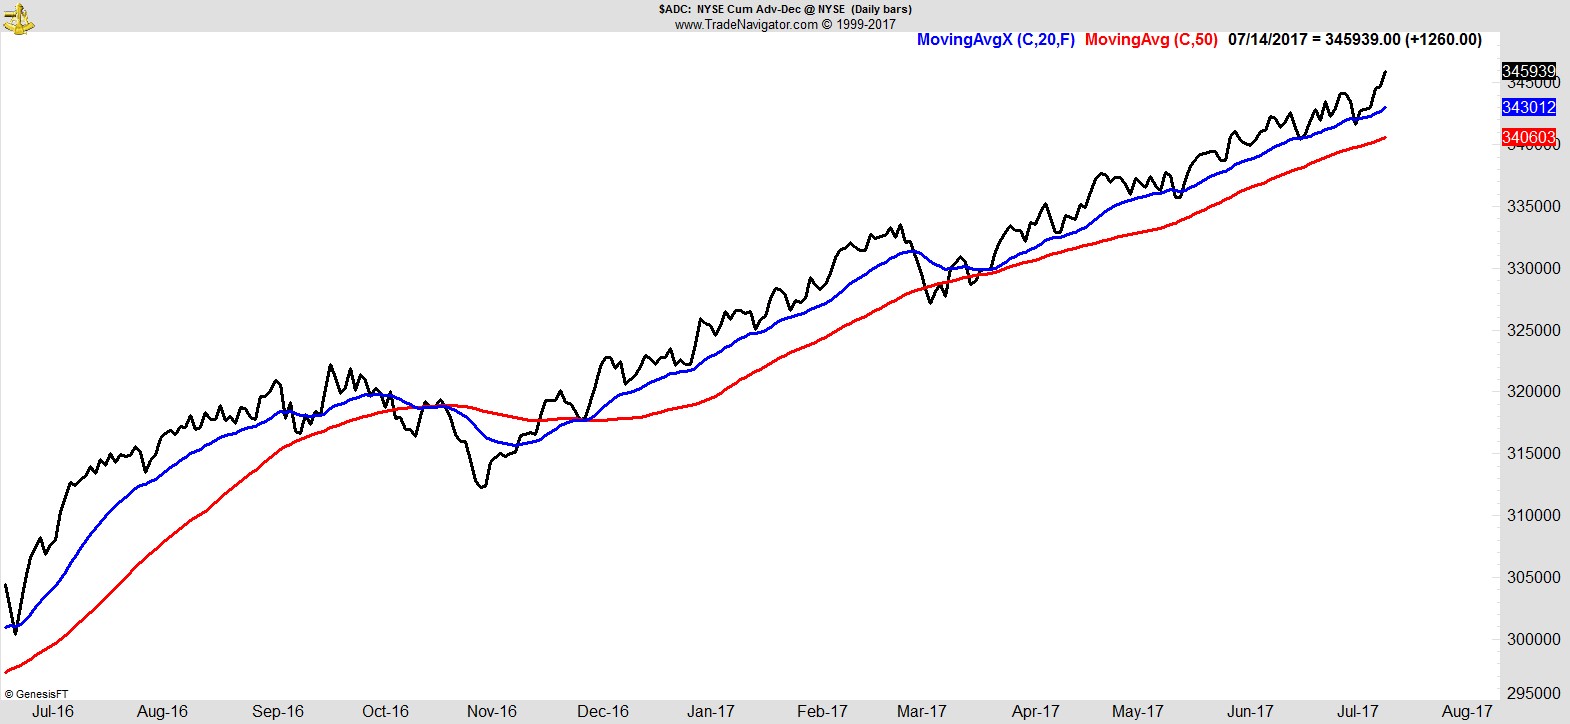
.
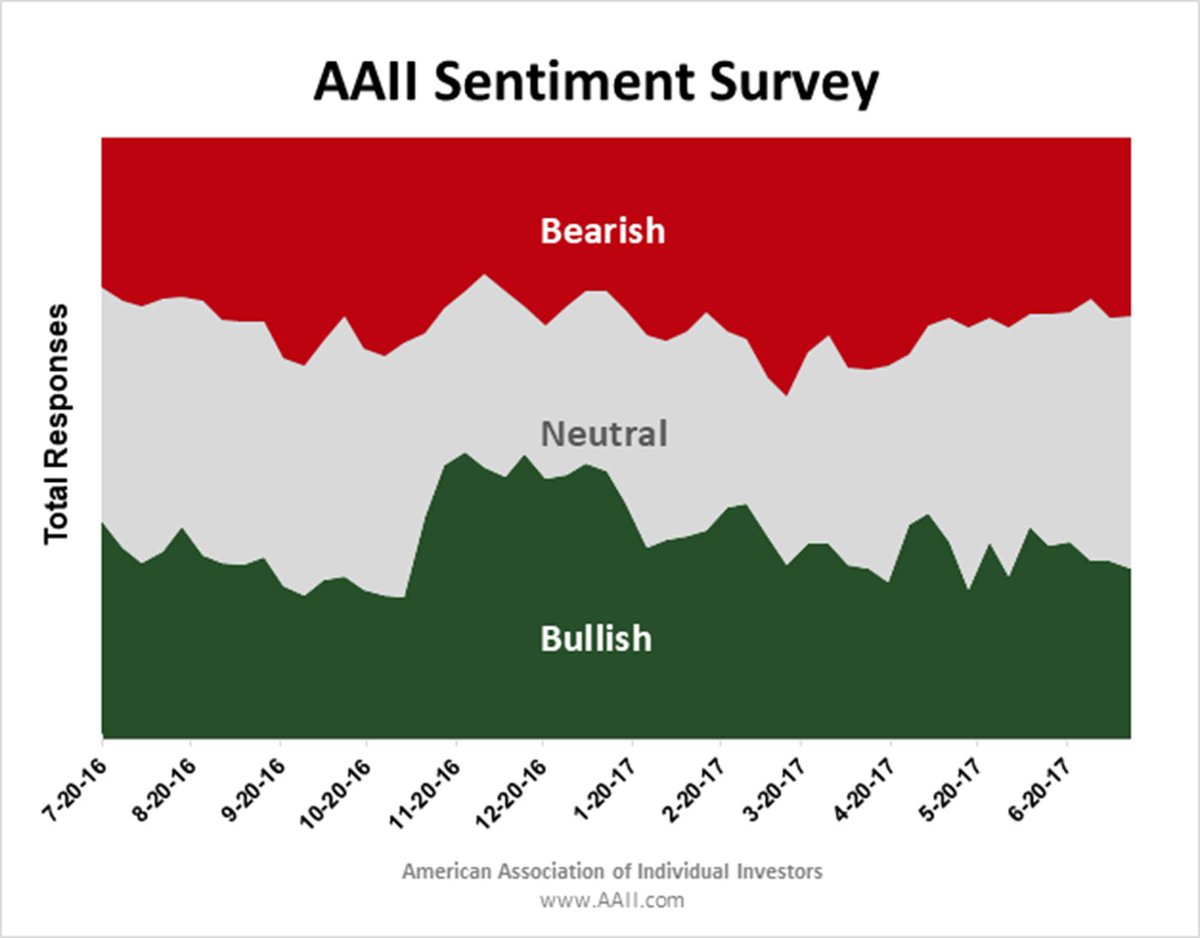
Bullish sentiment isn't.
.
Sector Rankings
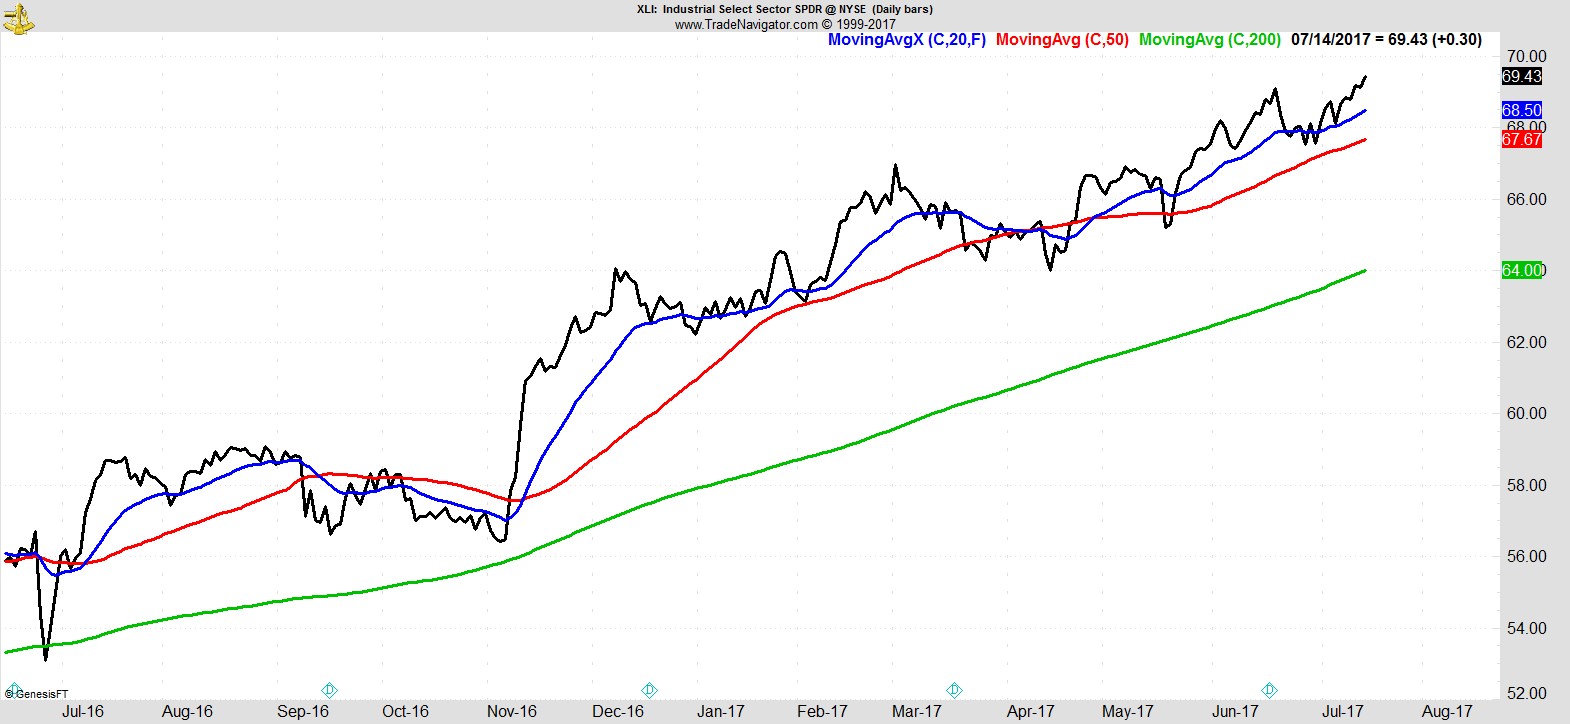
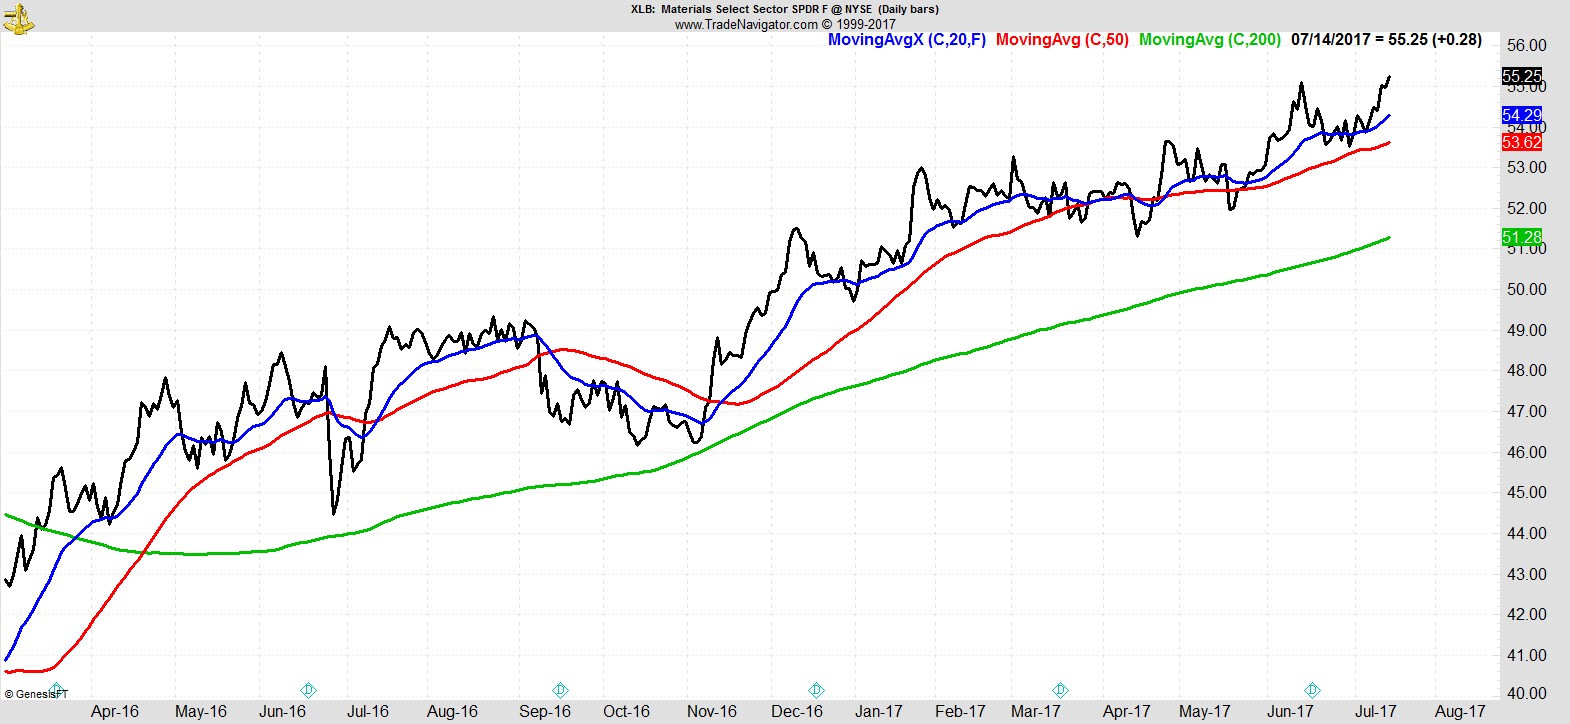
Industrials and Materials at all time highs lead the way.
.
They're followed by Healthcare, Tech, Financials, Cons Discretionary, and Real Estate which are all above their 20, 50, 200-day MAs.
At the bottom we Have Utilities, Consumer Staples, both below their 20 and 50-day, and Energy once again attempting to rally.

.
Alpha Capture Portfolio
Our model portfolio finished +0.6% on the week vs +1.4% for the S&P.
There are 10 open positions, with total open risk of 6.3%, and 9% cash.
.
Watchlist
A more extensive list this week which should come as no surprise with the market at all time highs along with breadth.
Here's a sample from the full list of 30 names:-
$RGLD

.
$A
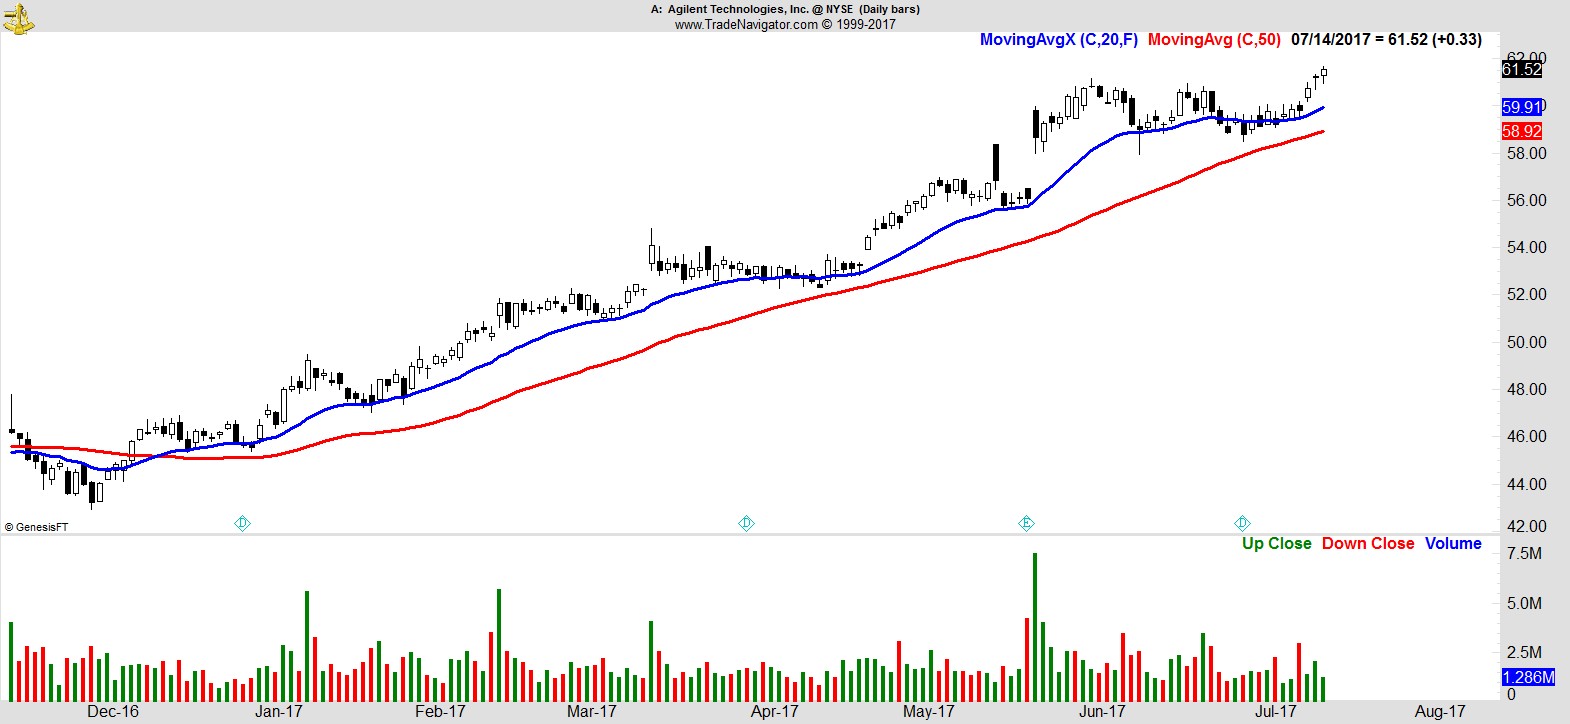
.
$ISRG
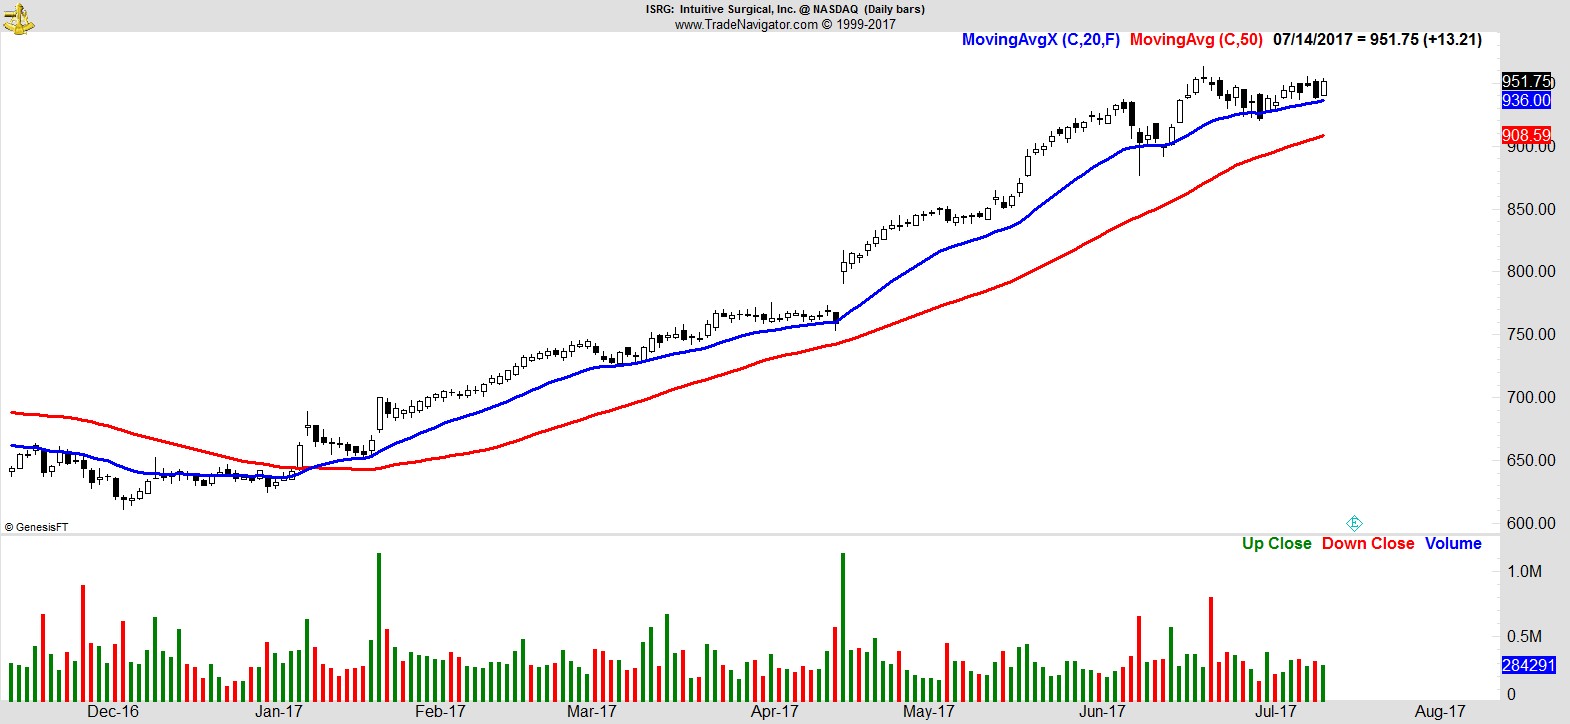
.
$VEEV
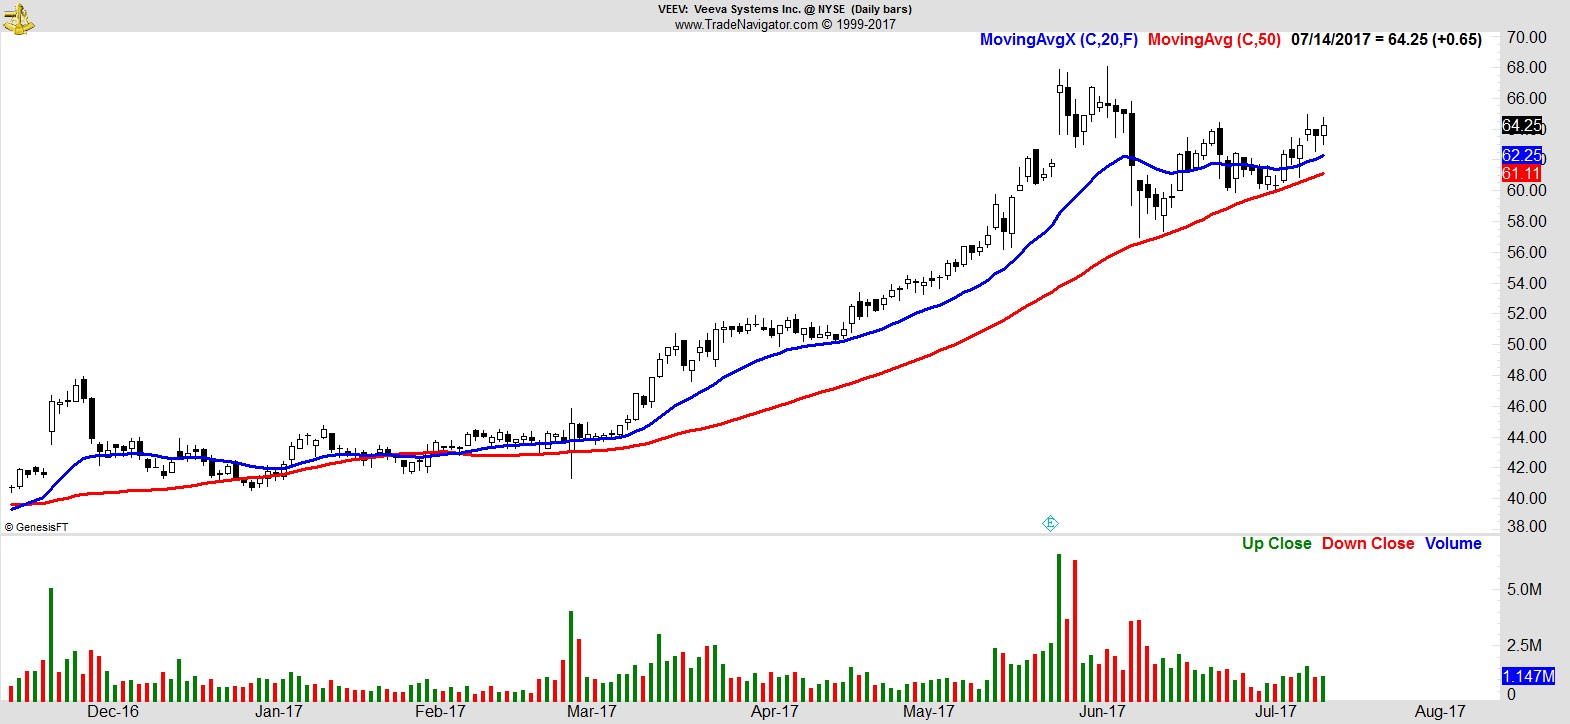
.
$SEDG
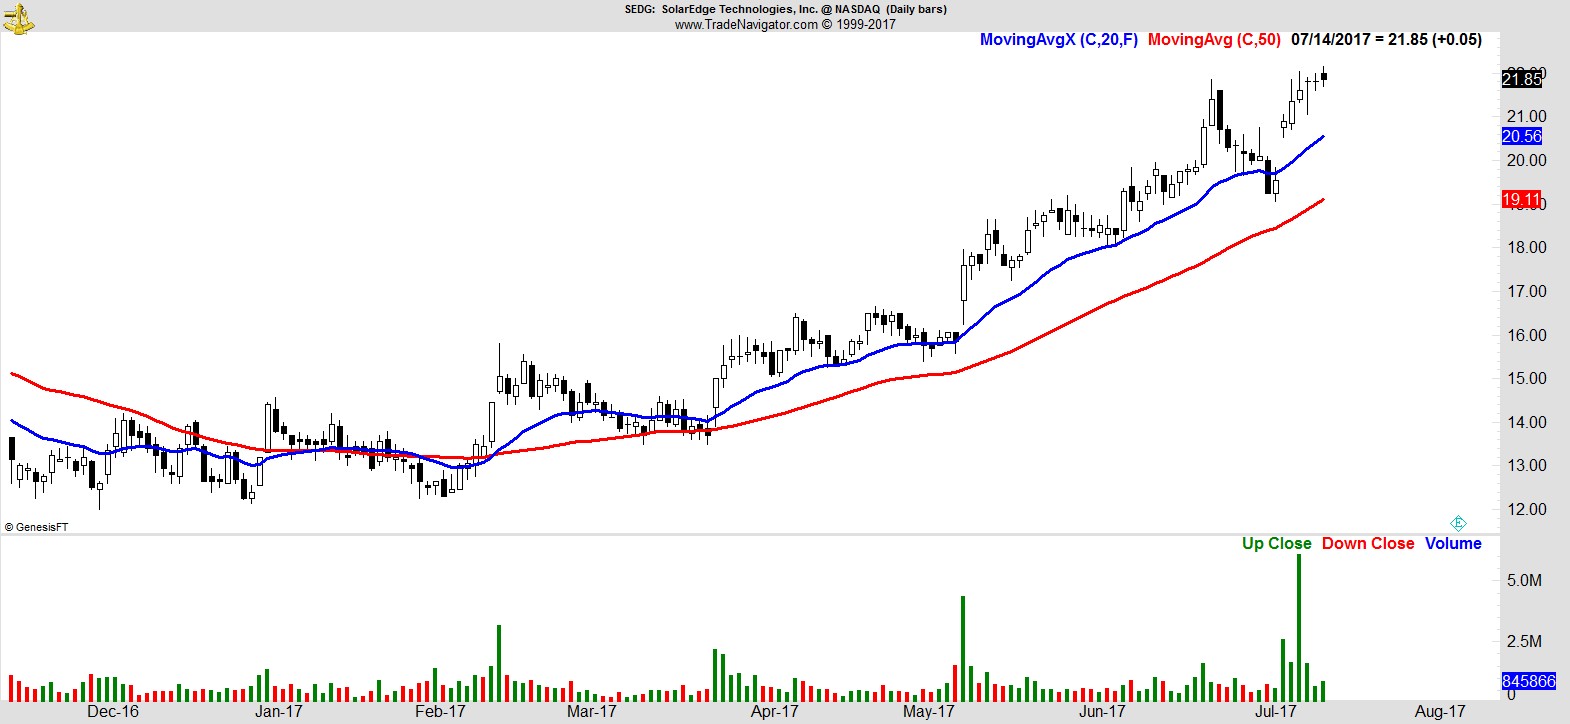
.
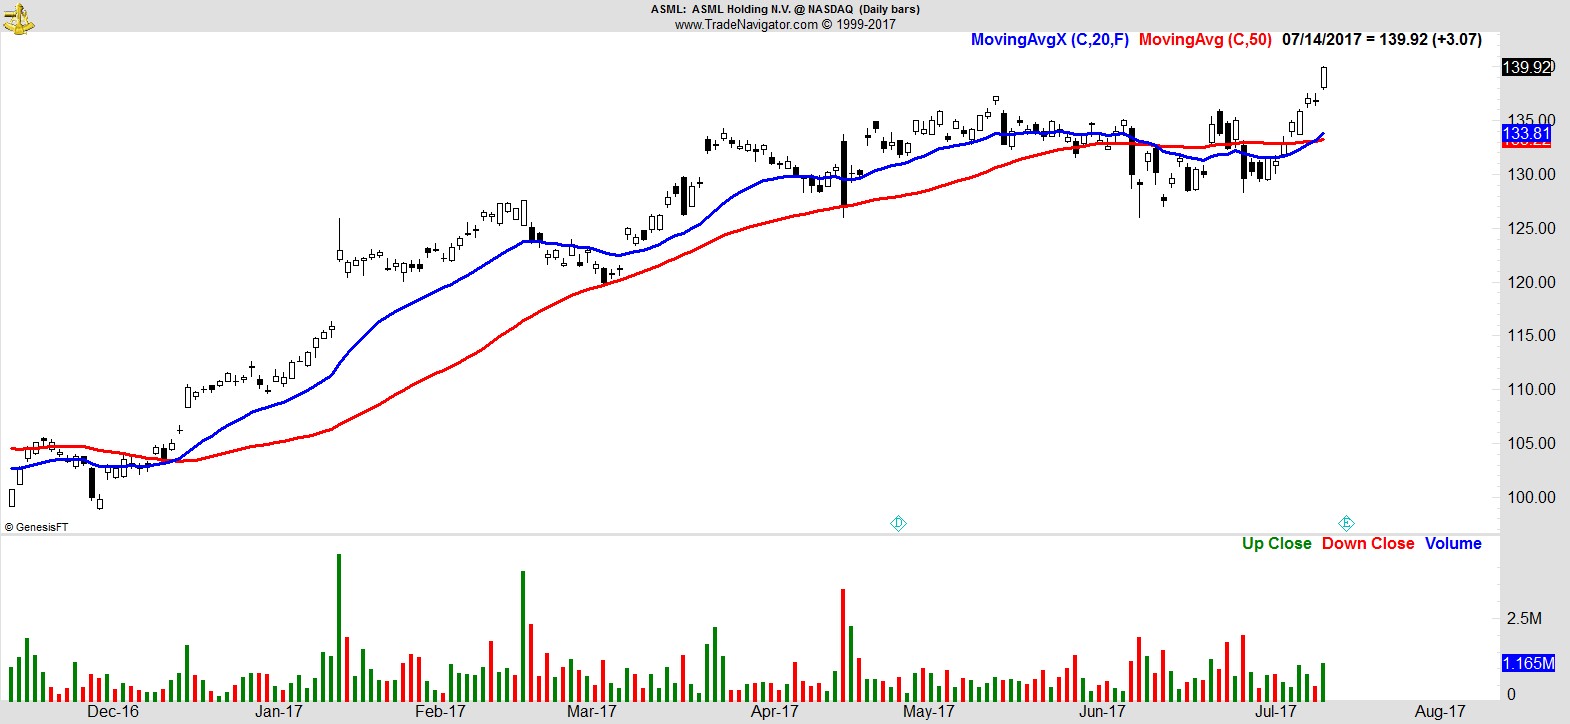
$ASML
.
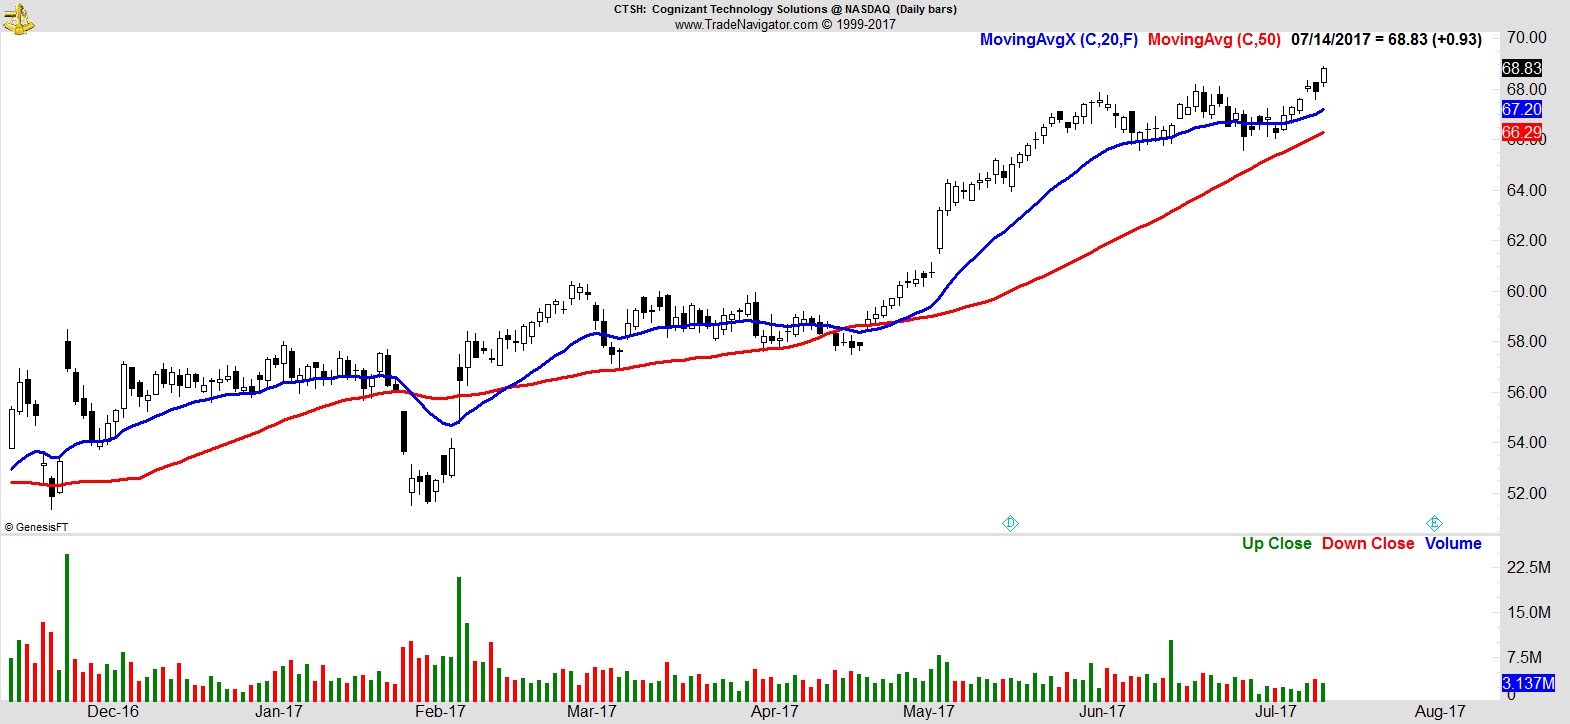
$CTSH
.
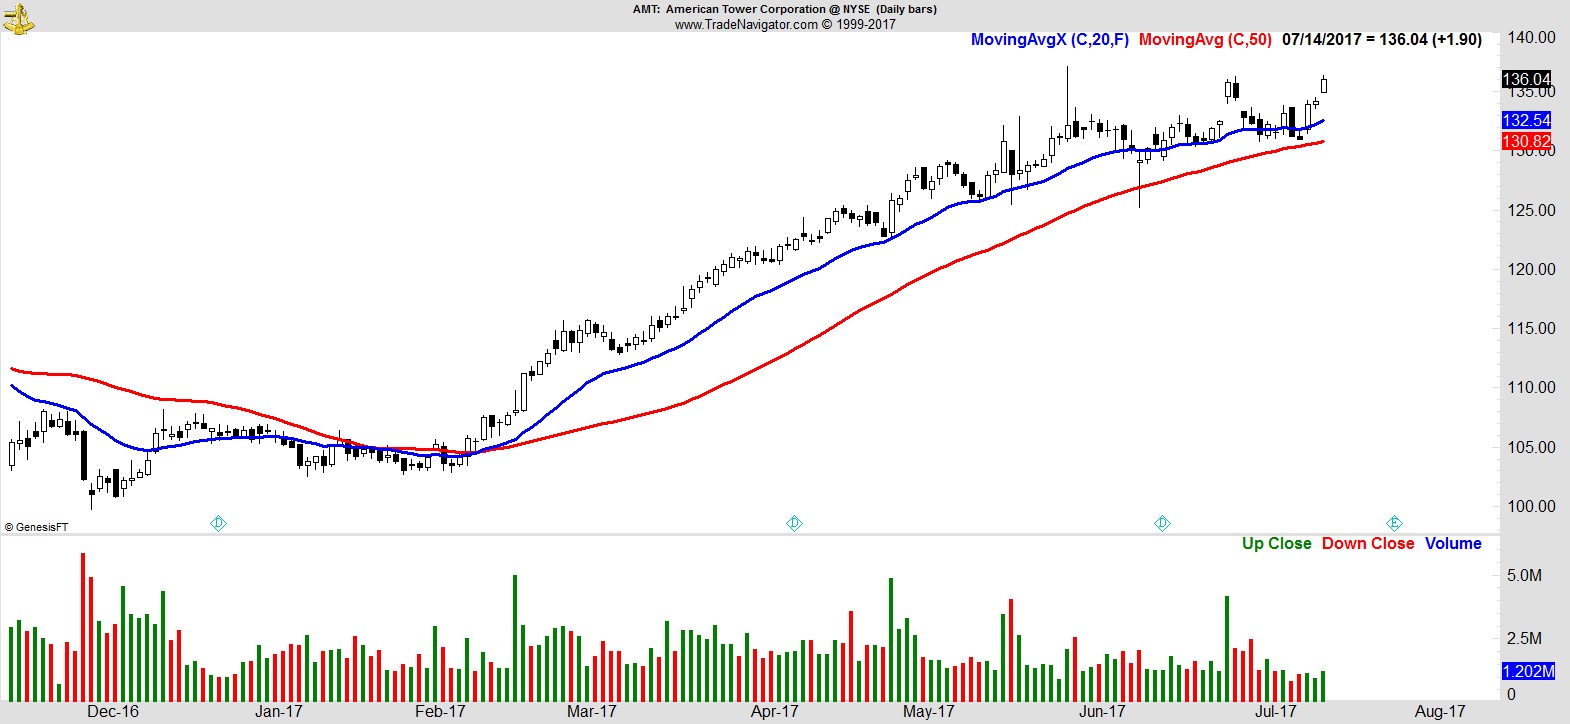
$AMT
.
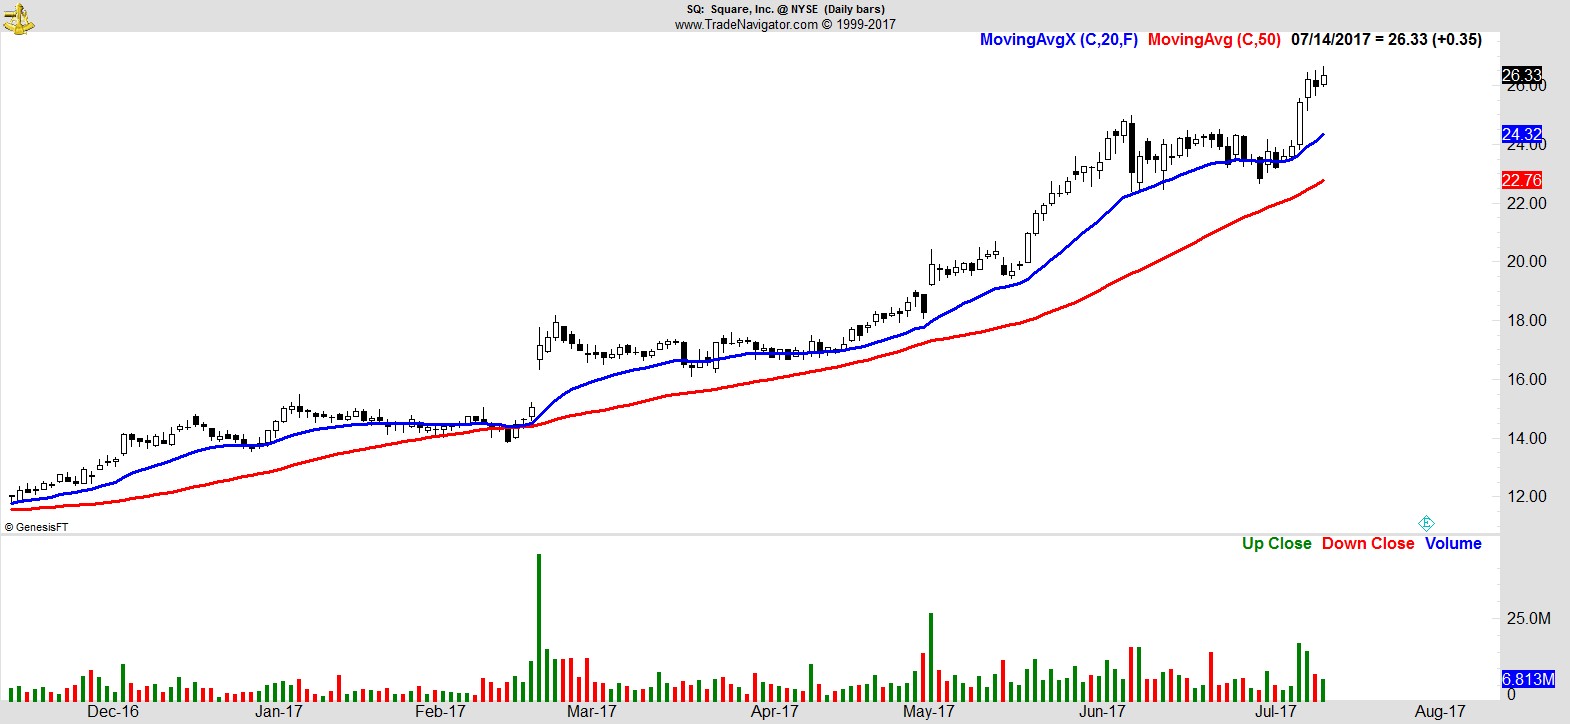
$SQ
.
$HTHT
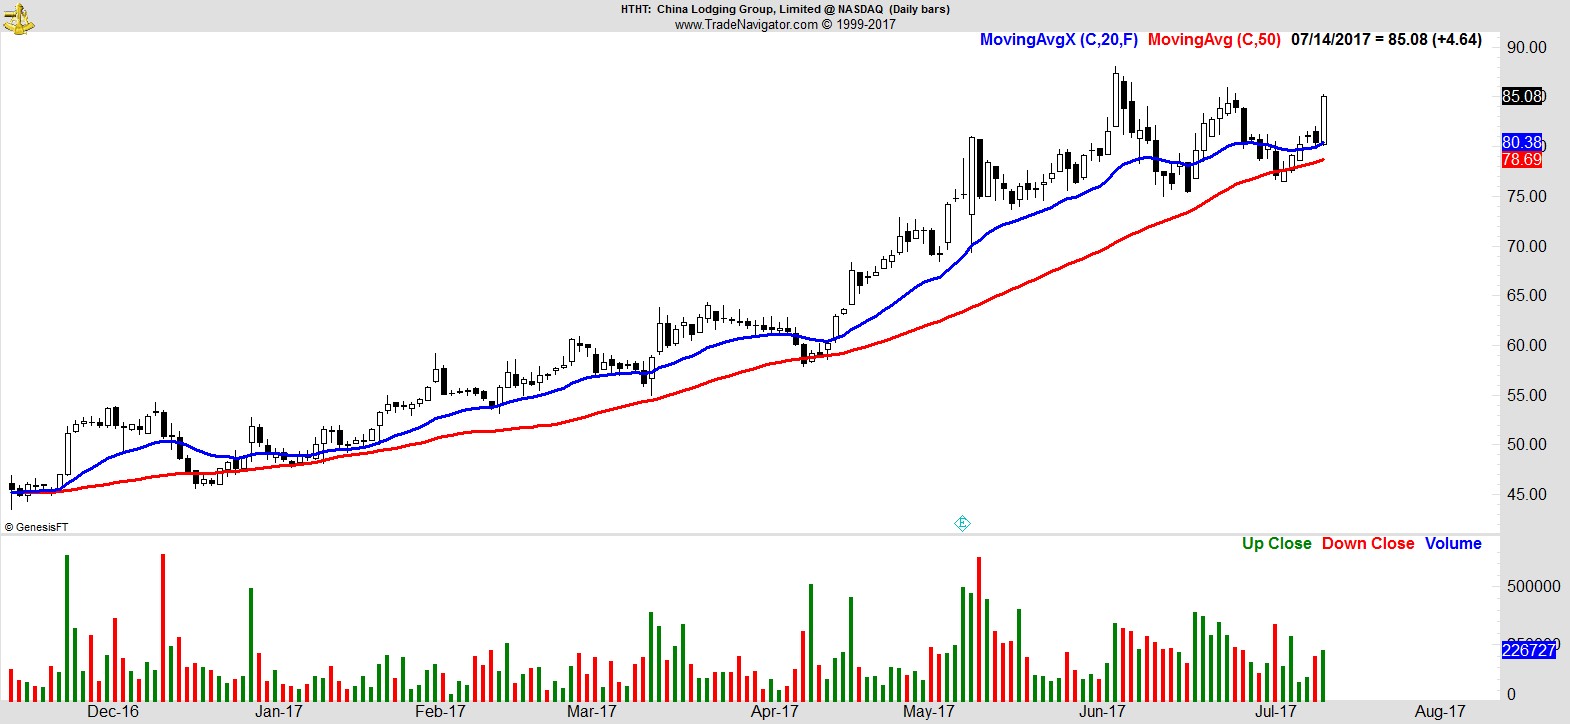
.
Recent free content from Jon Boorman
-
 Weekend Review and Watchlist
— 9/30/17
Weekend Review and Watchlist
— 9/30/17
-
Weekend Review and Watchlist
— 9/22/17
-
Weekend Review and Watchlist
— 9/17/17
-
Weekend Review and Watchlist
— 9/10/17
-
Weekend Review and Watchlist
— 9/02/17