

The "Mean-Reversion" Strategy Explained
The following article is sponsored by the Dr. Stoxx Options Letter
In my two previous articles on this topic, I detailed how traders and investors use one of the most common components of technical analysis, the simple moving average. A moving average is a running average of the closing price of a stock over x number of time periods. The two most widely used averages are the 50day and 200day moving averages. Moving averages are not just used by specially trained market technicians. Even financial analysts with Harvard MBA’s will refer to the 50day and the 200day moving averages as frequently as they do to P/E ratios and earnings growth rates.
In the previous articles, I talked about how moving averages help us get a good “read” of a stock’s price chart. We’ve seen how to use moving averages to determine the dominant trend of a stock or index, as well as the ideal points at which to enter or exit that trend. Today I want to bring my discussion of moving averages to a close by talking about one more way to use moving averages. This is, in fact, the most profitable technical trading strategy I use. In this strategy we are stressing the idea that certain moving averages – particularly the “big two”, the 50day and 200day averages – act as “magnets” for the price of a stock or index whenever it moves too far away from the averages.
The phenomenon I am referencing here has a fancy label. It’s called “mean reversion”, and it recurs so often in financial markets that studying it and learning how to profit from it have become a kind of cottage industry. Some of the world’s greatest financial minds, including Ivy League professors and Federal Reserve Bank economists, have published peer-reviewed papers on the subject.
The idea behind mean reversion, in a nutshell, is this: a moving average of share price represents the accumulation of wisdom on the fair market value of a particular company’s shares (and hence, of the company itself), while the day to day fluctuation in share price is more a reflection of the ever changing whims of market sentiment. Thus whenever that sentiment drives share price too far from its average, the efficiencies of market forces being what they are, share price is bound to revert back to its mean in short order.
Determining just when price has been stretched too far from its average, and just how far back to the mean it will travel when it does revert, is more art than science. But there is one tool that can help us greatly with this determination. Using past price performance over X number of time intervals, this tool measures standard deviation from a moving average and draws bands on the chart, both above the below the average, that show the upper and lower limits of that deviation. It is expected that price will stay contained within these bands going forward. This would be “normal” price action. Any move above or below the bands, therefore, signals an “abnormal” move beyond the standard deviation, hence an overextension that is likely to revert to the mean.
The tool I’m talking about here, of course, is Bollinger Bands, developed by market technician, John Bollinger, back in the 1980’s. I’ve used these bands for years and can say that, like most technical indicators, they work well when they work! But when the Bollinger Bands are not working well, your trading based on them can go horribly wrong. Still, when we couple the Bands with stop-losses to minimize the damage, they are the best tool we have for determining regions of price extremes where a stock or index is likely to get over-extended and flip back to the mean.
Let me show you some examples. In the chart below you’ll see shares of EBAY, Inc. (Nasdaq: EBAY) with the 200day moving average overlaid, along with the upper and lower Bollinger Bands set at 1.5 standard deviations away from the average. You can see how over the past 9 months, whenever price travelled outside either band, it was only a matter of time before it bounced back the other direction.

I used a standard deviation of only 1.5 on the 200day moving average in the above chart because it takes a significant move to get even that far away from such a long-term moving average of price. When we shorten our time frame down to the 50day average, however, we’ll need to increase our deviation from 1.5 to 2.0 to reduce the noise of false signals.
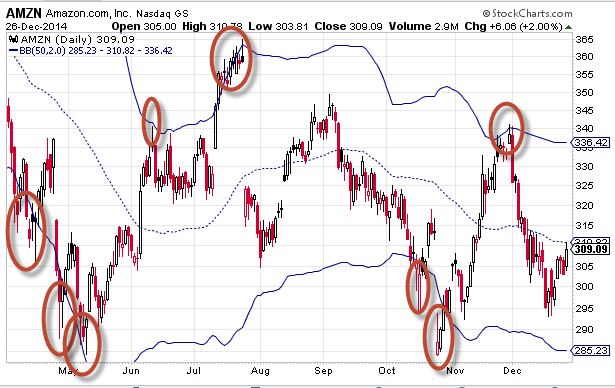
Here is a chart of Amazon, Inc. (Nasdaq: AMZN) during a rather inefficient, tumultuous time in the stock’s recent history. I have here overlaid the 50day moving average with bands set at 2.0 standard deviations away from the average. You can see a greater number of signals compared to the chart above, and also that some signals would have been more profitable than others.
As you work with Bollinger Bands, you will want to refine your trading system. You cannot simply buy every dip below the lower Band and sell short every rally above the upper Band. As you experiment, I suggest integrating some of the following suggestions into your trading system:
- Only take buy signals at areas of price support and sell signals at areas of price resistance
- Don’t trade minor moves beyond the Bands but only those that exceed the Bands by a certain percentage (you can use the %B Bollinger Band Indicator for this determination)
- Try entering only when price closes outside the Bands on one day, then closes inside the Bands on the next day
- Only take trades when Bands are wide and avoid trades when Bands are constricted
Mean reversion theory is a well attested phenomenon that, when learned well and traded appropriately, can be a very profitable approach to the markets. If you are looking for more resources on this trading system, you might want to try the Mean-Reversion Trading Manual I offer on my website, DrStox.com. You can also look at my book, Market Neutral Trading, where I fully explain how I use this trading system. But certainly the original source is always a good place to start too: Bollinger on Bollinger Bands, the “bible” of the Bands!
Recent free content from Dr. Thomas Carr
-
{[comment.author.username]} {[comment.author.username]} — Marketfy Staff — Maven — Member


- 1 Campus Martius, Suite #200Detroit, MI 48226
- +1 877 440 9464