

I'm still skeptical of this market...
...and here's why!
Wave counts and Elliott Wave rules just don't paint a bullish picture:
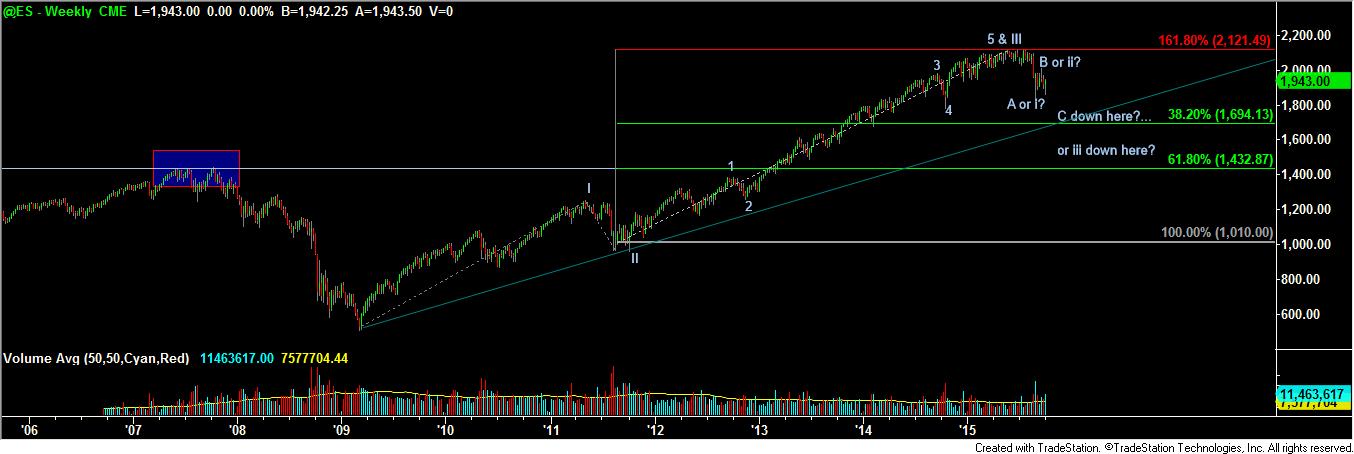
- On a very macro perspective (using the weekly chart below), the S&P is set up for a relatively deep correction off of the highs for this wave (wave IV) since the second wave in the sequence (wave II) was a relatively shallow correction of the first wave.
- In Elliott Wave Theory, there is something called The Rule of Alternation which states that if wave 2 was a shallow retrace of wave 1, then wave 4 will be a deep retrace of wave 3. On the other hand, if wave 2 was a deep retrace of wave 1, then wave 4 should only be a shallow retrace of wave 3.
- In this scenario, wave II occurred from May 2011 until August of 2011 and was only a 38.2% retracement of wave 1 (relatively shallow). Now, we are in the midst of wave IV which should be a deeper retracement (typically at least 50% and frequently 61.8%) of wave III. A 50% retracement of wave III would bring the S&P futures down to 1536 and a 61.8% retracement would take the futures all the way down to the 1430 - 1450 range. Not coincidentally, the 1430 level basically is right at the pre-financial crash peak from October of 2007. The market has a funny way of eventually testing out major levels like that.
- Even an unexpectedly shallow 38.2% retracement would mean a drop in the S&P futures from 1943 down to 1694. The lowest we hit thus far has been 1831.
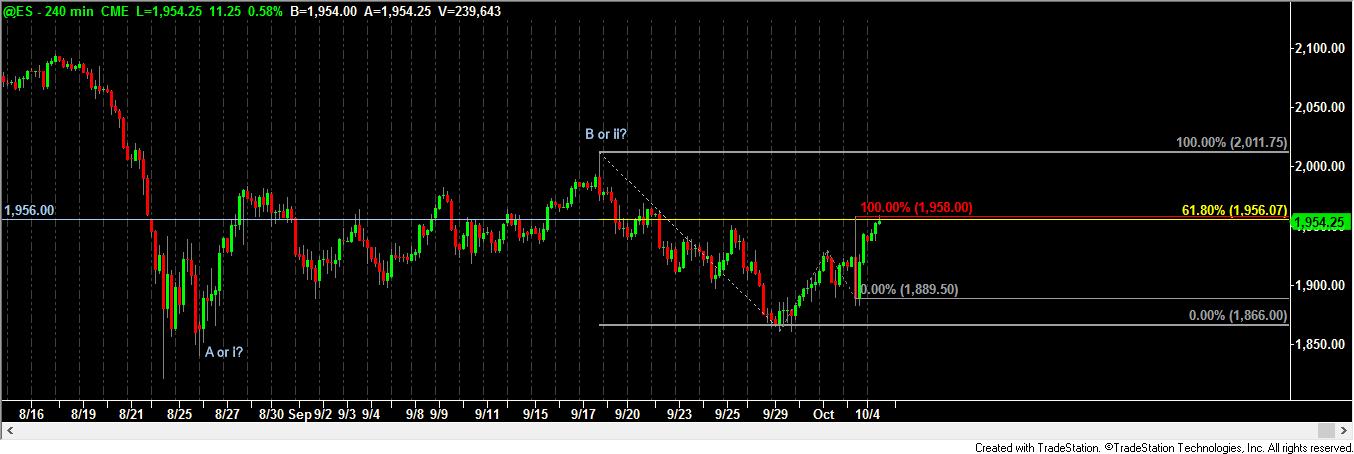
- On the daily chart below, it looks like the S&P futures completed either wave A or wave "i" right around the time the Dow opened the session down 1000 points or shortly thereafter. The subsequent rally / rebound looks like an "abc" upside correction for wave B or "ii". Then, we saw another thrust lower to 1861 and then the violent / volatile upside action to the upside on Thursday and Friday. The thrust down to 1861 and subsequent rally looks to me like the initial stages of either wave C lower (which would have a downside target range of 1694 to 1756) or wave "iii" lower (which would have a downside target range of 1599 to 1659). In either case (wave C or wave "iii"), the best case is a move down to 1756 from Friday's close of 1943.
- In the very short-term (using a 60-minute chart), the wave count points to more downside ahead unless nearby resistance at 1943.75 - 1958 can be conquered. Various models show 1943.75 as being the first potential resistance for what appears to be wave "c" of an "abc" upside correction (wave B or "ii" noted above). Other models that use different pivot point extend all the way up to 1958.
- Looking for confirmation, we overlay the Fibonacci retracement lines on the chart from the 9/17 peak to the 9/27 low and we get the 61.8% retracement line coming in anywhere from 1949 to 1954.
- Another measuring technique employed on the 10-minute chart has the upside projection coming in at only 1943.75 (and the futures closed Friday at 1943).
- So, the violent Friday rally that occurred may have a little juice left (up to 1958 at best), but should lead to a reversion to bearish conditions shortly - conditions that should take the S&P futures down to 1756 at best (although not expected), 1694 (more likely) and as low as the high 1500s (ouch).
Summing all this "jargonese" up:
I know this is not welcome news for those long of equities at a higher cost basis, but I'm not at all feeling that the bear market is over. I will, however, be quick to change stances should evidence that I'm on the wrong side of the fence present itself.
- Long-term investors!!!
- You should be using the strength on Thursday and Friday as an opportunity to lighten up on stocks if you feel you have too much exposure there.
- If you're already in cash or bonds, then stay there unless and until the technical evidence tells us that the bear market is over.
- You can always jump back in on the long side (bullish or owning stocks / stock funds) if the evidence tells us we're wrong to be bearish.
- Short-term traders!!!
- Use the recent strength as an opportunity to short the market if you are so inclined - using QID (2x short the NASDAQ) or SPXS (3X short the S&P).
- If you don't want to play that (risky) game, then simply step aside and sit out the expected bearish conditions in cash or bonds.
How will we know the reality is different from what I am seeing?
If the S&P futures move above 1959 on a 60 minute close, it will mean that a move up to at least 1980 and perhaps higher is under going on (and even then, it would not necessarily spell the end of the bear market). We'll know soon enough - likely Sunday night or Monday sometime which way things will be headed in the short-term. Stay tuned for updates.
Recent free content from Peak Analytics & Consulting
-
 S&P futures may see short-term bounce ahead of test of 4,005
— 8/26/22
S&P futures may see short-term bounce ahead of test of 4,005
— 8/26/22
-
NASDAQ futures update...
— 3/08/22
-
AAPL historical pattern could lead market lower
— 8/03/20
-
UPDATED S&P FUTURES LEVELS BASED ON TODAY'S ACTION...
— 12/20/18
-
Headed to 2412 - 2417
— 12/20/18
-
{[comment.author.username]} {[comment.author.username]} — Marketfy Staff — Maven — Member
Reviews


- 1 Campus Martius, Suite #200Detroit, MI 48226
- +1 877 440 9464